
Autocorrelation Is Why Some Drawdowns Hit Harder Than Volatility Predicts
Autocorrelation Is Why Some Drawdowns Hit Harder Than Volatility Predicts
Autocorrelation measures whether investment returns are statistically related across time. In plain English, it tells you whether losses tend to arrive randomly—or in clusters.
That distinction explains why some drawdowns feel survivable, while others feel devastating, even when traditional risk metrics look identical.
Most investors never examine this. They should.
The common misconception
Risk is volatility. Control volatility, and drawdowns should be manageable.
That belief is built on a quiet assumption: returns are independent from one period to the next.
Markets rarely behave that way.
The first-principles correction
Returns have memory.

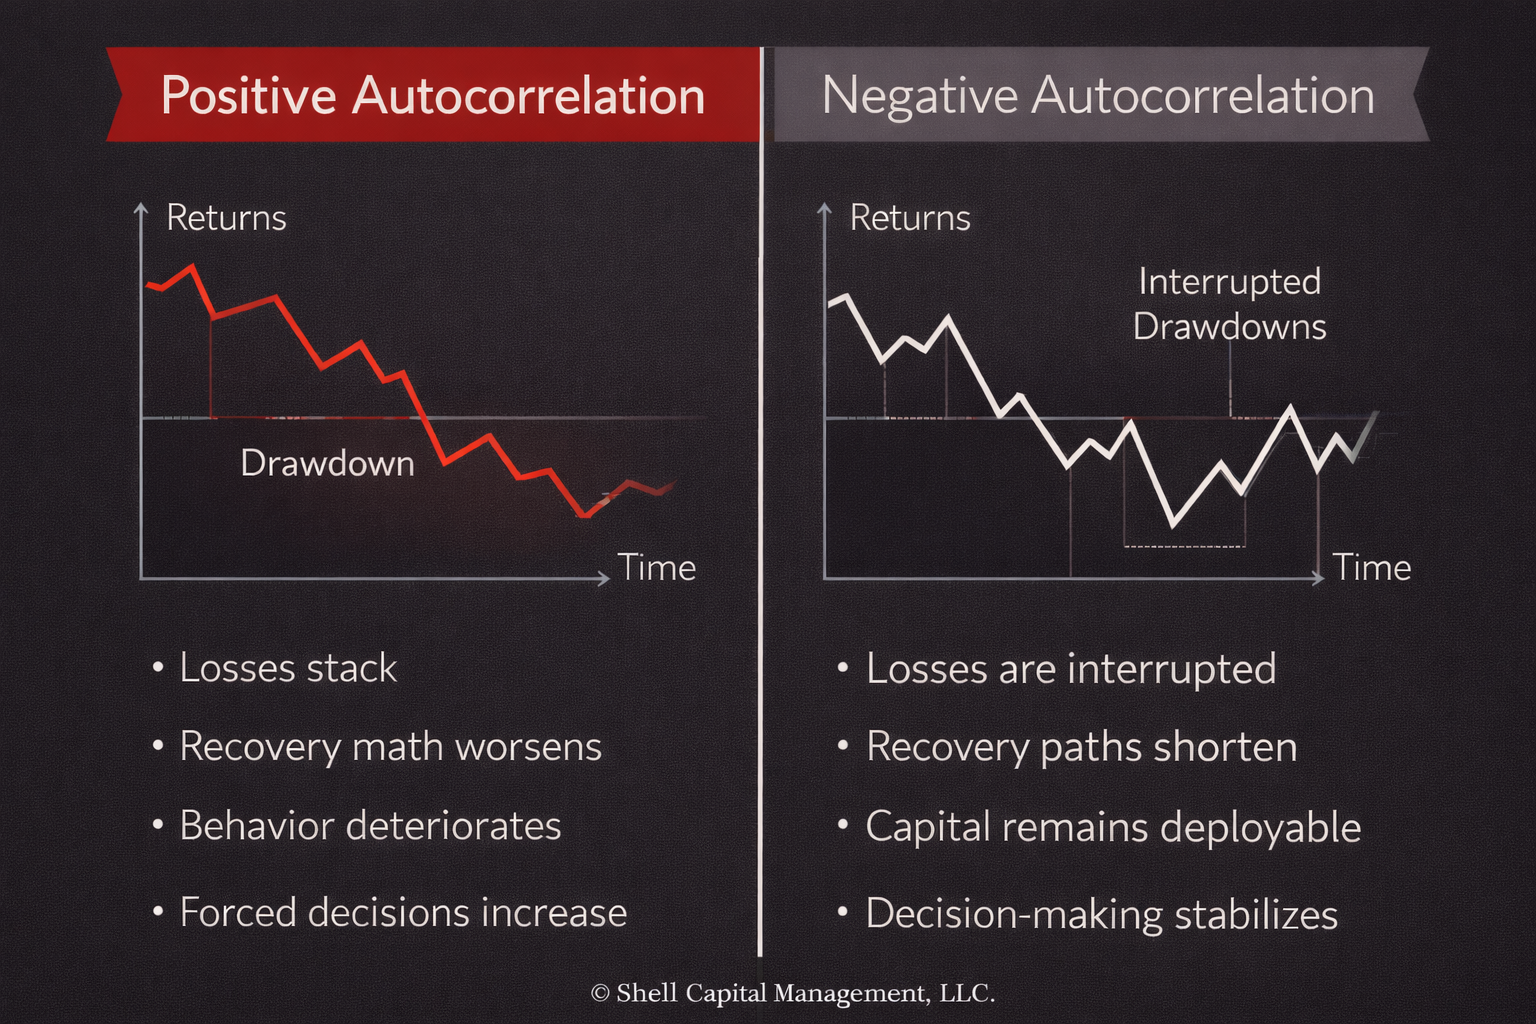
When returns are positively autocorrelated, losses tend to follow losses. Drawdowns deepen not because any single loss is extreme, but because losses arrive back-to-back, denying capital the chance to recover.
When returns are negatively autocorrelated, losses are more likely to be interrupted. Drawdowns are naturally shallower, even if volatility is unchanged.
Same average return. Same volatility. Completely different outcomes.
Why volatility understates drawdown risk
Most risk models assume independence and scale risk using square-root-of-time math.
That math breaks when returns are serially correlated.
Positive autocorrelation quietly magnifies downside risk without showing up in volatility, Sharpe ratios, or optimization outputs. This is why investors are often shocked by drawdowns that felt “statistically impossible” beforehand.
They weren’t impossible. They were sequenced.
The geometry of asymmetry
Autocorrelation is not a nuance. It’s risk geometry.
Positive autocorrelation creates convex pain:
- losses stack
- recovery math worsens
- behavior deteriorates
- forced decisions increase
Negative autocorrelation introduces structural optionality
- losses are interrupted
- capital stays deployable
- recovery paths shorten
- downside asymmetry improves
This is why two strategies with similar long-term returns can feel radically different to live with—and why defining downside matters more than forecasting upside.
Boundary conditions and failure modes
Negative autocorrelation is not a free lunch. In persistent, one-directional markets it can lag.
Positive autocorrelation can feel powerful during strong trends—right up until regimes shift and losses begin clustering.
The failure occurs when investors mistake trend persistence for risk control.
If the downside isn’t explicitly defined, autocorrelation will define it for you.
Why this matters for high-net-worth investors
High-net-worth capital isn’t managed in spreadsheets. It’s managed through paths.
Drawdown depth and duration affect:
- liquidity decisions
- tax timing
- behavioral discipline
- redeployment opportunities
This is why two portfolios with similar long-term statistics can produce radically different real-world outcomes.
Volatility describes dispersion. Autocorrelation determines damage.
Reinforcing conclusion
If you don’t understand how losses sequence, you don’t fully understand risk.
Asymmetry isn’t just about upside capture. It’s about preventing losses from arriving in the worst possible order.
Define the downside. Or the market will define it for you.
Mike Shell is the Founder and Chief Investment Officer of Shell Capital Management, LLC, a registered investment adviser. He serves as portfolio manager of ASYMMETRY® Managed Portfolios, a separately managed account program with trade execution and custody provided by Goldman Sachs Custody Solutions.
ASYMMETRY® Observations are provided for general informational and educational purposes only. They do not constitute investment advice, a recommendation, or an offer to buy or sell any security or investment strategy. The content is not intended to be a complete description of Shell Capital’s investment process and should not be relied upon as the sole basis for any investment decision.
Any securities, charts, indicators, formulas, or examples referenced are illustrative and are not intended to represent actual client portfolios, recommendations, or trading activity. Past performance is not indicative of future results. All investing involves risk, including the possible loss of principal.
Opinions expressed reflect the judgment of the author at the time of publication and are subject to change without notice as market conditions evolve. Information is believed to be reliable but is not guaranteed, and readers are encouraged to independently verify any information before making investment decisions.
Shell Capital Management, LLC provides investment advisory services only to clients pursuant to a written investment management agreement and only in jurisdictions where the firm is properly registered or exempt from registration.