Asymmetric Risk: Definition, Meaning, and Why It Matters
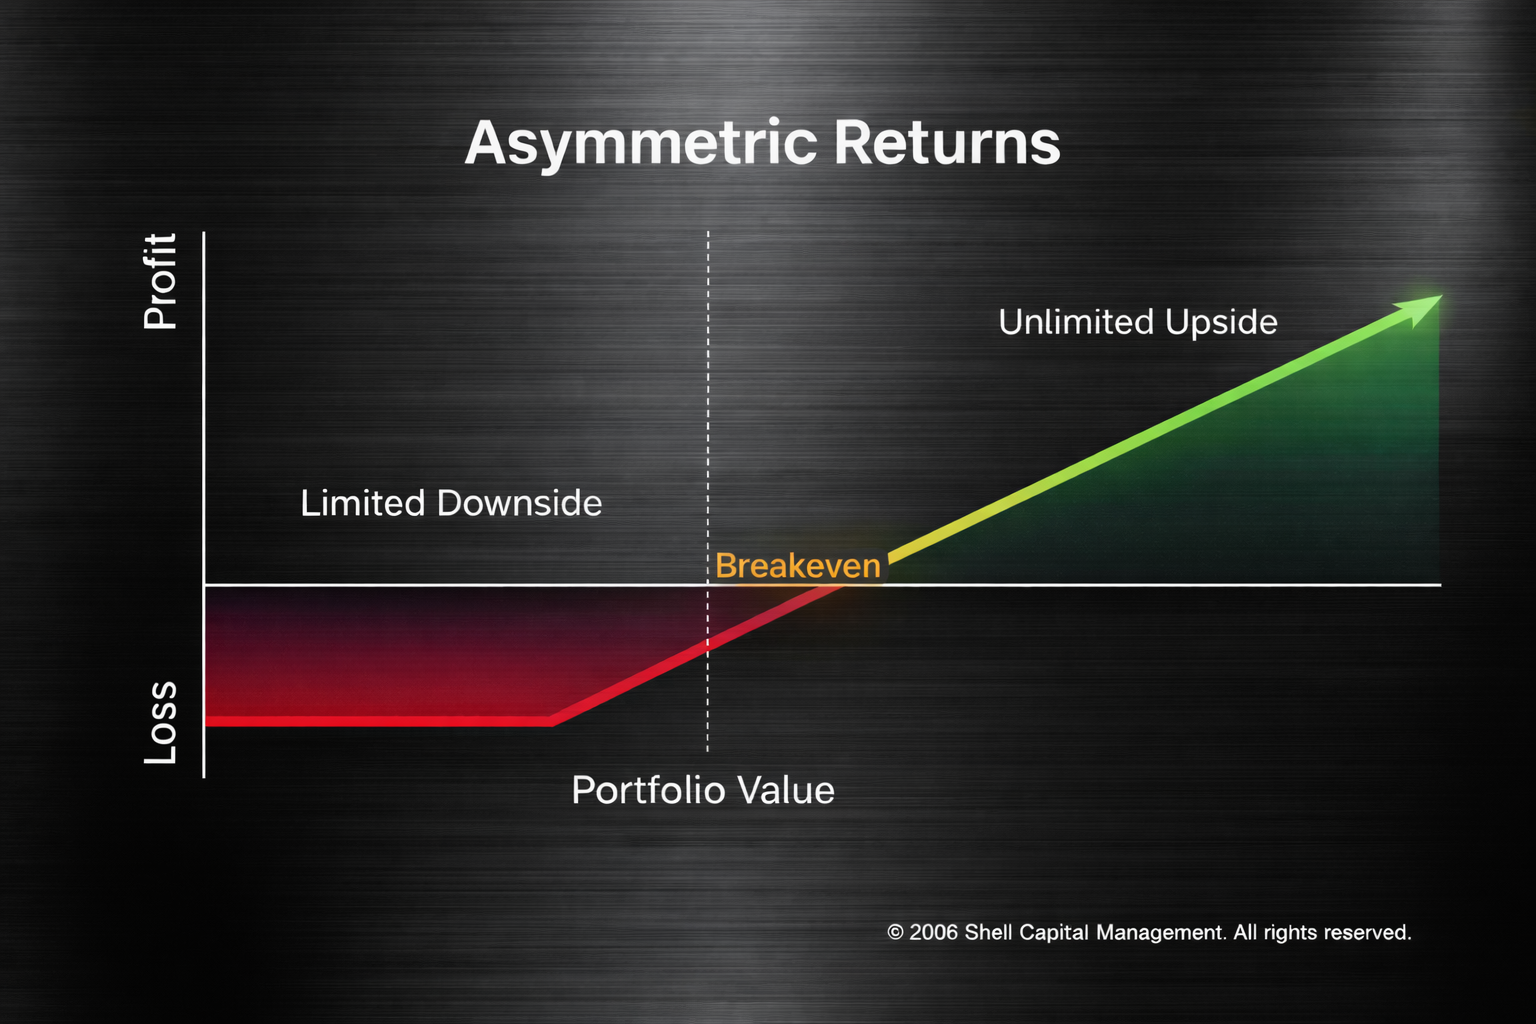
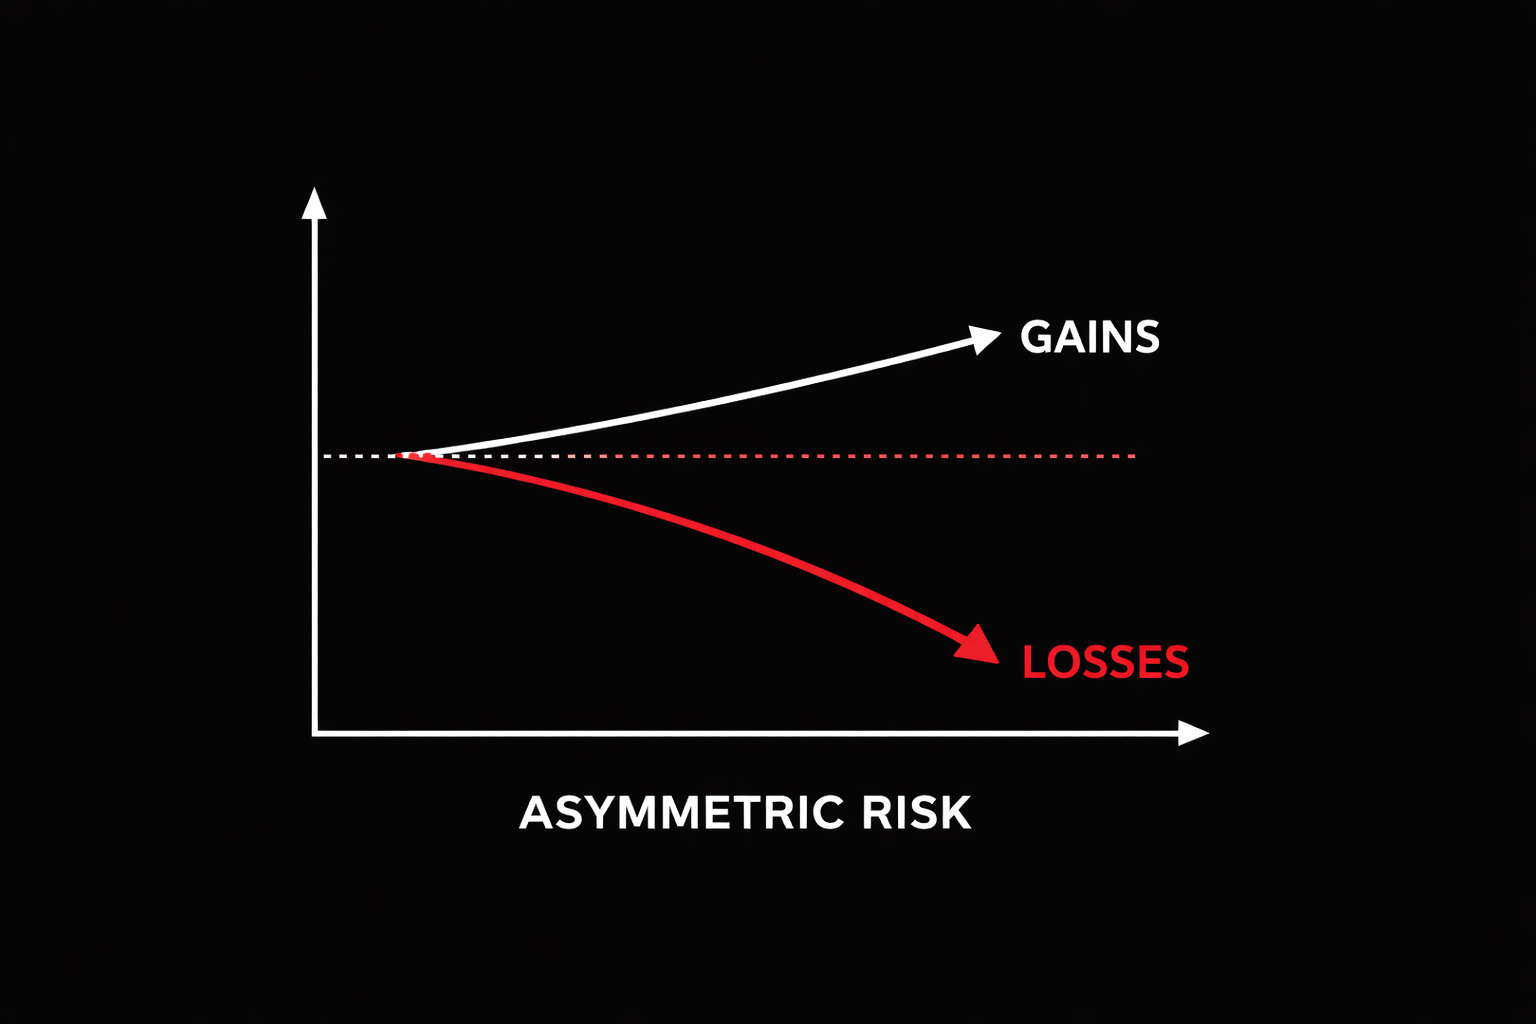
Asymmetric risk is the unequal and disproportionate impact that losses have on invested capital relative to gains due to compounding mathematics. Because losses reduce the capital base, larger percentage gains are required to recover from drawdowns. As a result, downside exposure can impair wealth faster and more permanently than equivalent upside gains can restore it.