
The Market’s Leverage Trap: When Borrowed Confidence Becomes Forced Selling
Margin debt is easy to misuse.
A record high doesn’t mean the market has to decline. Markets grow. Account values grow. A larger equity market can support more nominal debt than a smaller one.
So the headline isn’t the signal.
The signal is the combination.
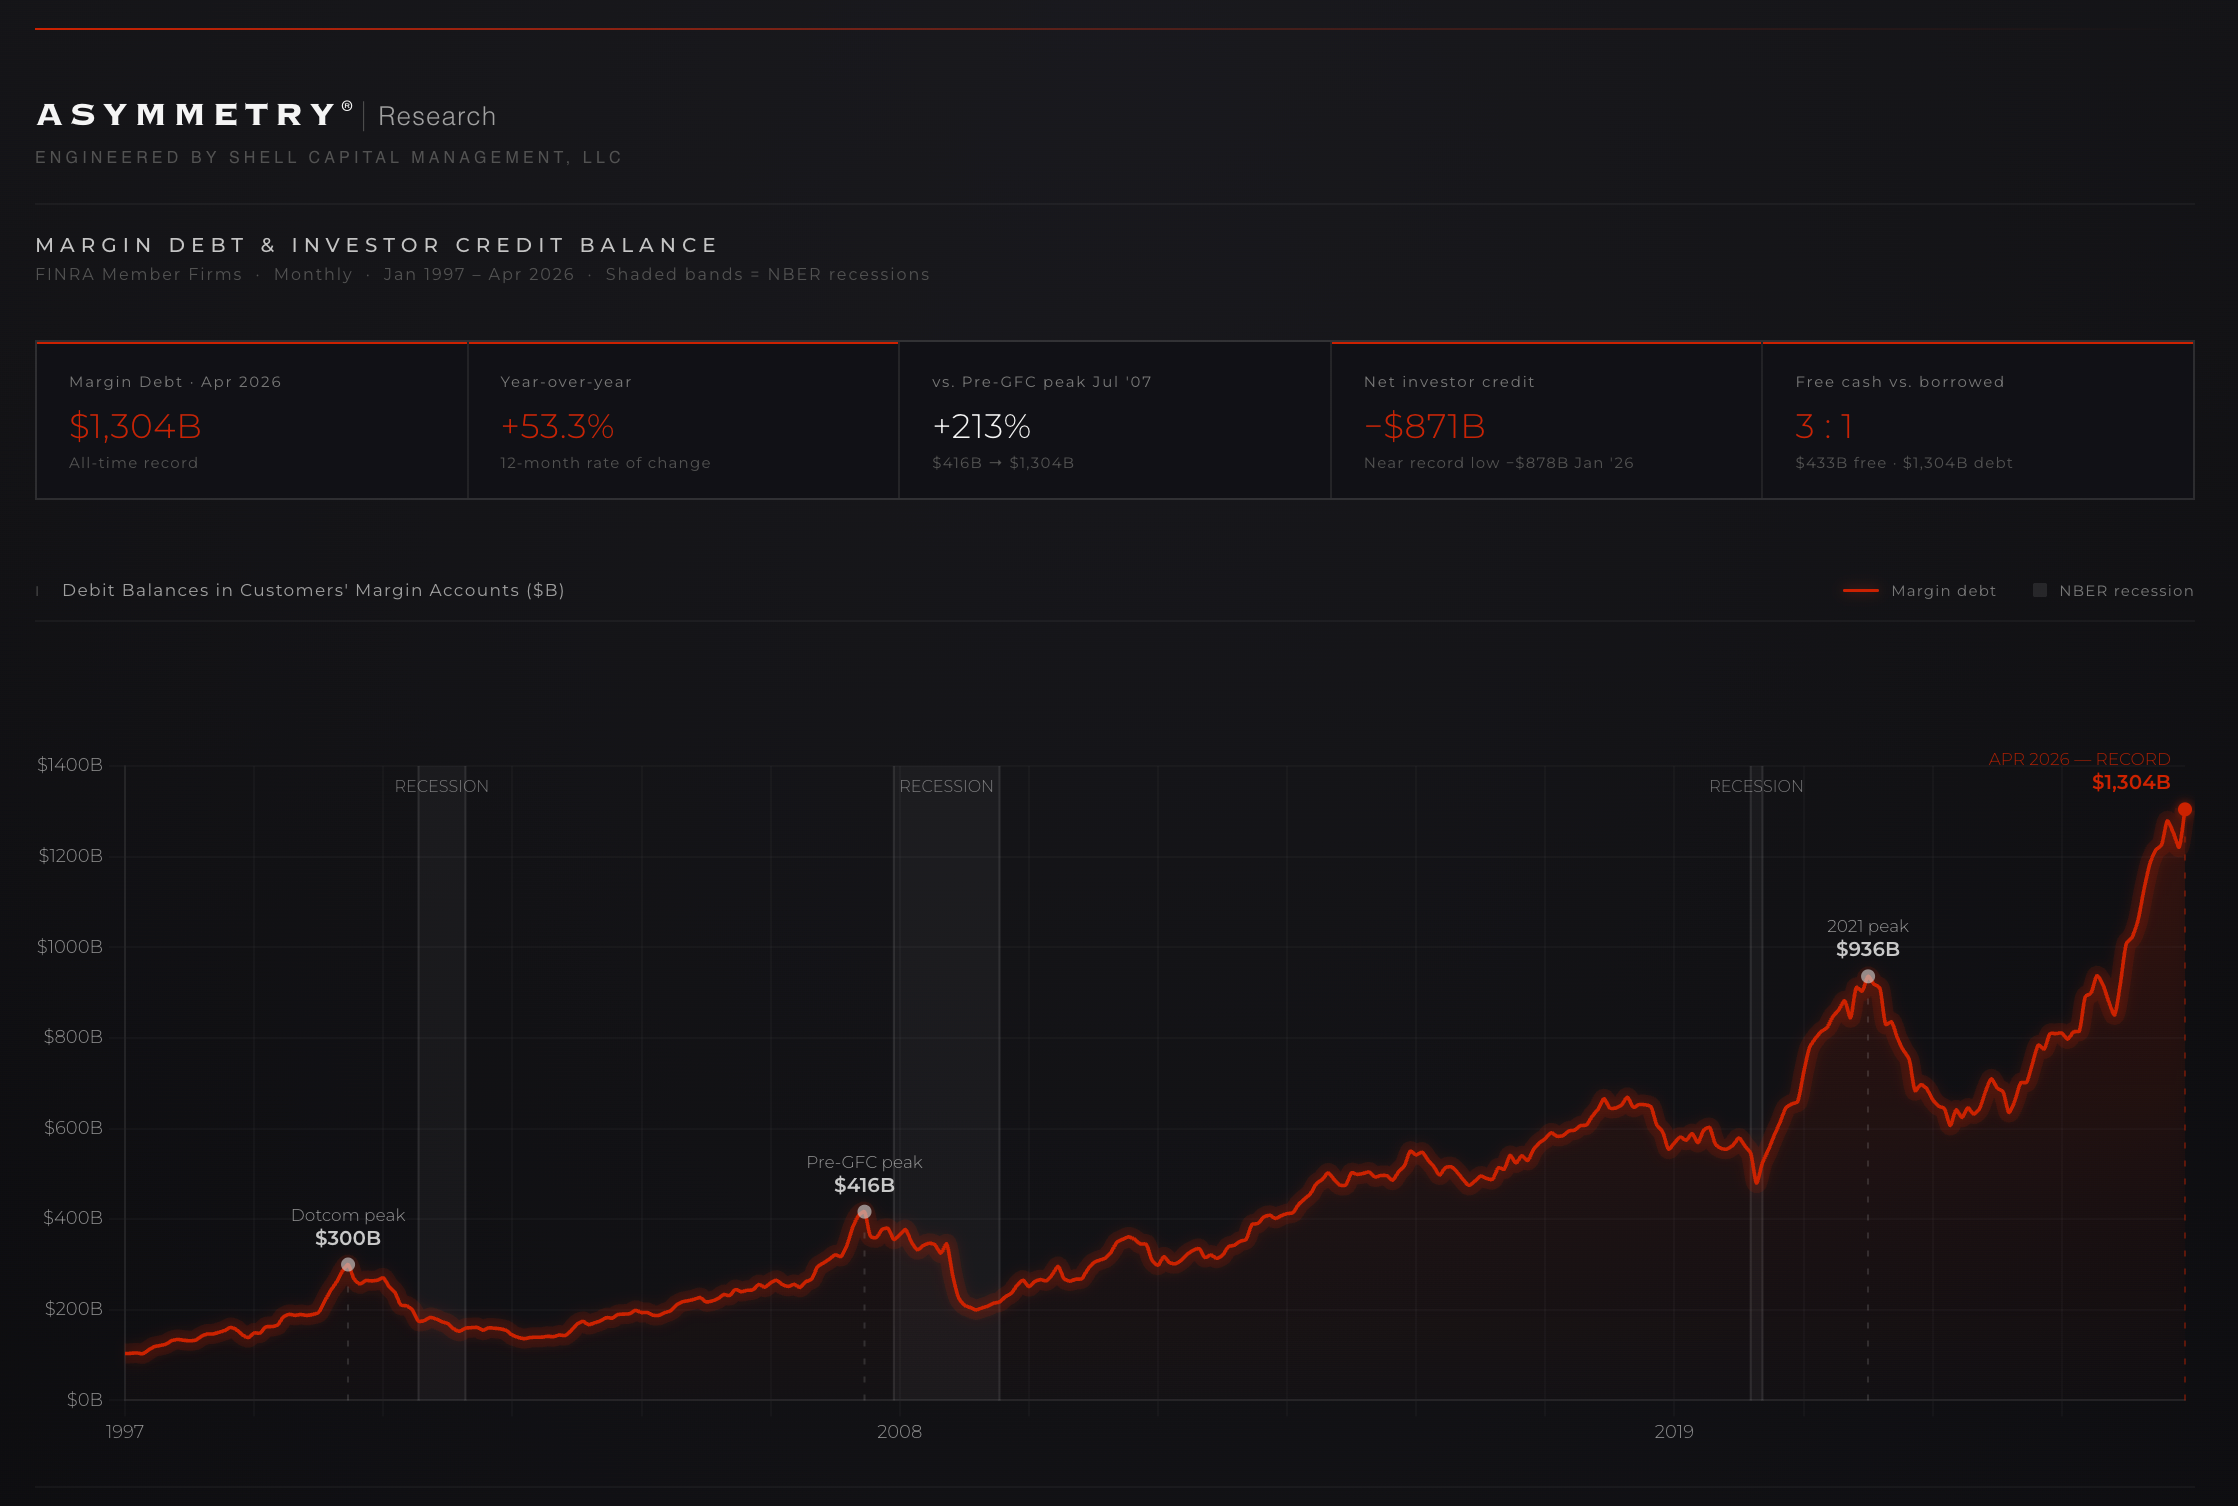
Margin debt reached approximately $1.304 trillion in April 2026.
Margin debt increased approximately +53.3% year-over-year.
Net investor credit was approximately -$871 billion.
Free cash was ~one-third of borrowed margin debt.
That mix says investors haven’t just participated in the uptrend. They’ve increasingly financed it.
Borrowed money can extend an advance. Rising prices increase account equity. Higher account equity expands borrowing capacity. More borrowing can support more buying.
That loop can work for a while.
It can also reverse faster than most investors expect.
When prices fall, collateral values fall. When collateral values fall, borrowing capacity shrinks. When borrowing capacity shrinks, leveraged investors may have to cut exposure into weakness.
That’s the asymmetry.
Upside participation is voluntary.
Downside liquidation can become mandatory.

The chart shows total debit balances in customers’ margin accounts.
This is the raw leverage figure.
At approximately $1.304 trillion, margin debt is at an all-time record. That matters, but it has to be interpreted correctly. A larger market can carry more debt, so the record alone isn’t enough to call a major top.
The better question is whether borrowed exposure is expanding faster than the market’s ability to absorb it.
The chart shows a recurring pattern. Margin debt rose into the dot-com peak. It rose into the pre-GFC peak. It rose into the 2021 peak. Now it has pushed to a new record.
That doesn’t give us a clock.
It gives us a pressure reading.
More borrowed exposure is now embedded in the market than at any prior point since 1997. It changes the risk profile because leverage can turn a normal decline into something less orderly.
With cash-only exposure, investors can choose to sit through volatility.
With borrowed exposure, the decision can become constrained by account equity, collateral values, maintenance requirements, and broker risk limits.
The chart says the market has more borrowed fuel.
The next chart in our margin dashboard is the Net Investor Credit Balance and the cleaner fragility chart.
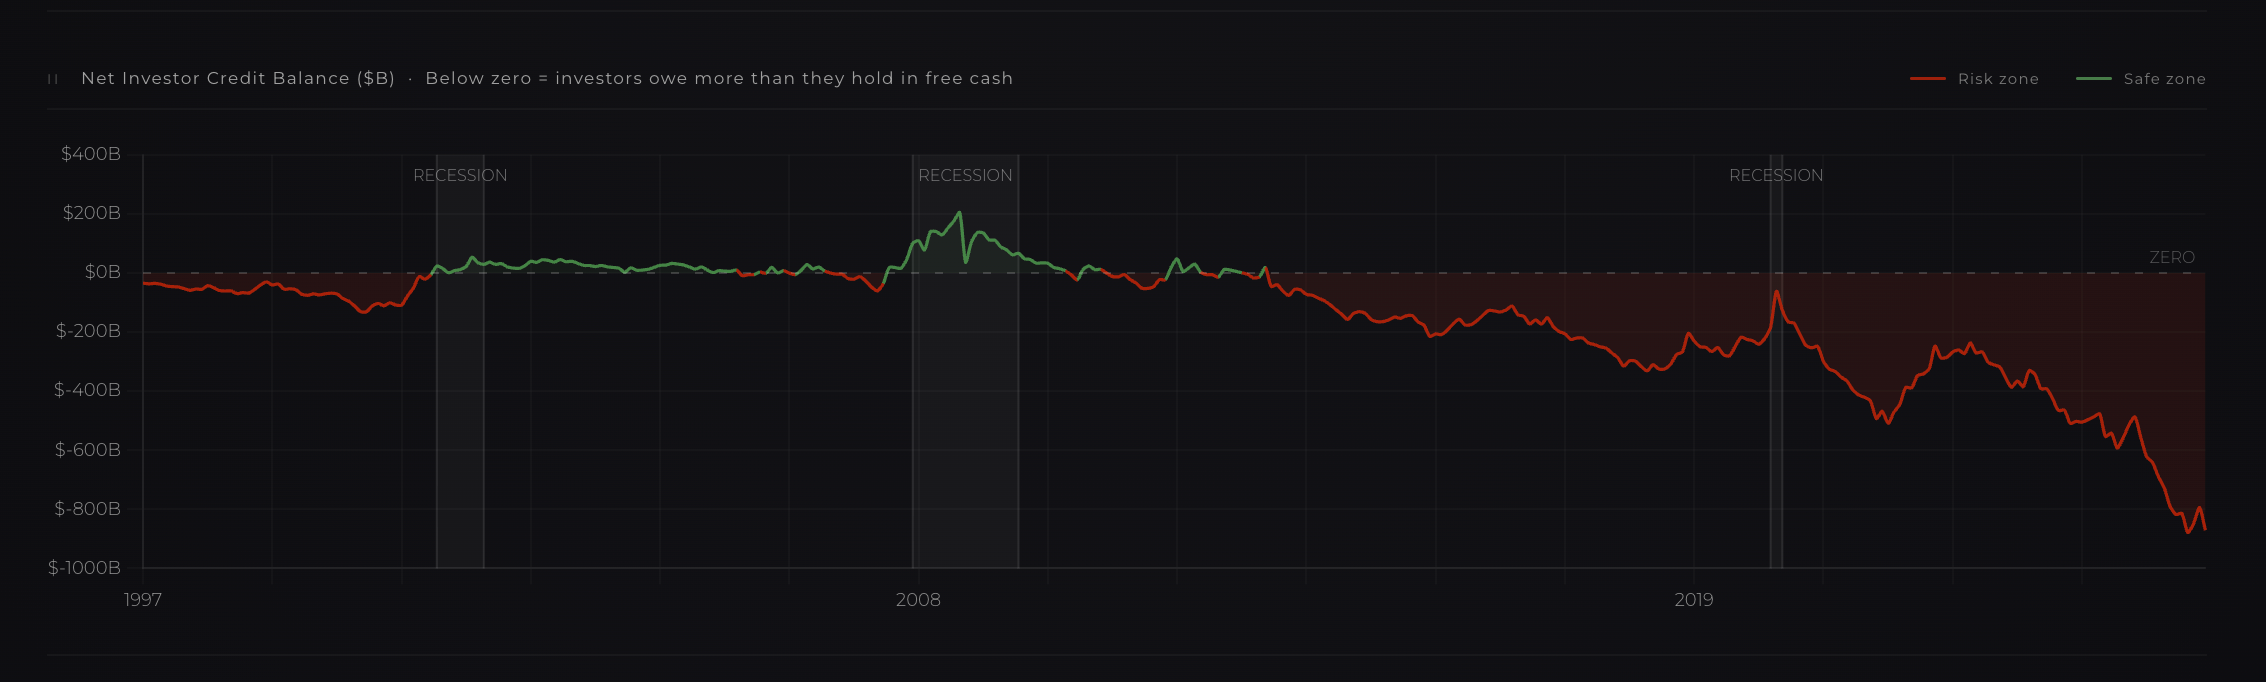
Net investor credit compares free cash balances against margin debt. When the line is below zero, investors owe more through margin debt than they hold in free credit balances.
Net Investor Credit Balance is deeply below zero.
That doesn’t mean there’s literally no cash in the system. It means the cash cushion is thin relative to the amount of borrowed exposure.
That distinction matters.
A market with a meaningful cash cushion can absorb stress better. A market with a large debt load and a thin cash cushion has less room for error if prices weaken, volatility rises, or liquidity dries up.
The current reading near -$871 billion says investors are carrying a large net debt position against a relatively small free-cash buffer.
In plain English, the market has less shock absorption than the index level alone suggests.
This is where a lot of commentary misses the real issue.
The risk isn’t just that margin debt is high. The risk is that margin debt is high while investor credit is deeply negative.
It means borrowed exposure has grown while the visible cash cushion has deteriorated.
If prices keep rising, it can continue to work.
If prices fall far enough, it can become a balance-sheet problem.
Investors don’t just become less confident. Some become forced sellers.
Net Investor Credit Balance says the market has less cushion behind the borrowed fuel.
Comes now, the 12-Month Rate of Change. It shows the 12-month rate of change in margin debt.
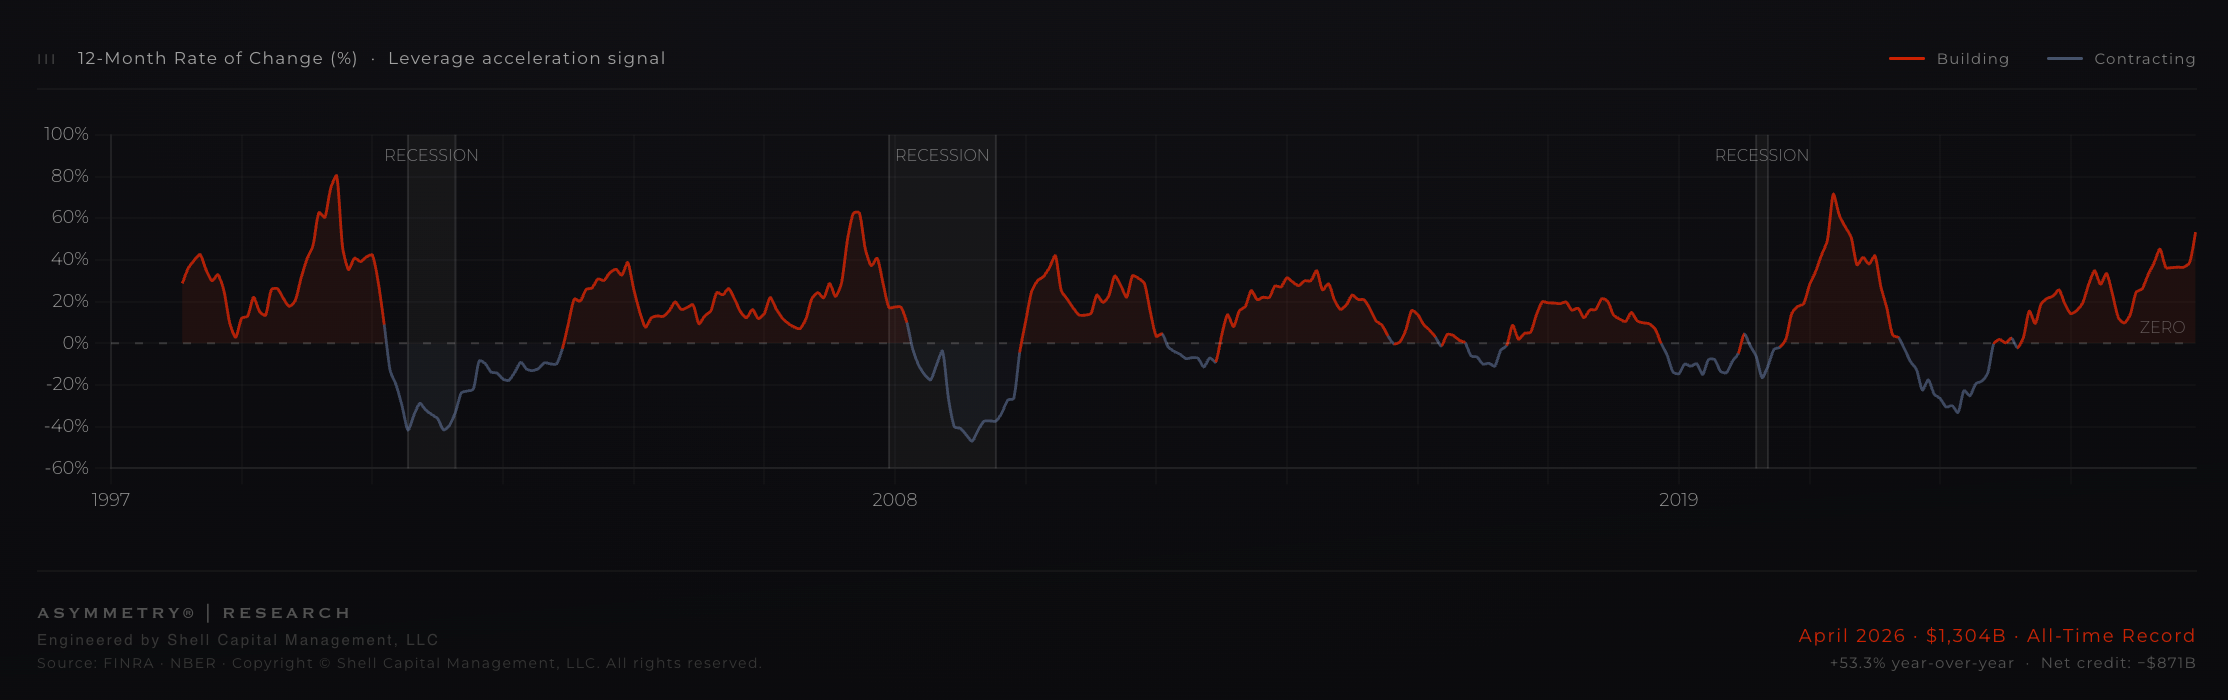
This is the velocity signal.
A high level of leverage is one thing. A rapid increase in leverage is another.
At approximately +53.3% year-over-year, margin debt isn’t just high. It’s accelerating.
This usually happens after confidence has already been rewarded. Investors borrow more after the trend has worked, not before. That’s why margin debt often looks strongest late in the cycle, when the market has already trained investors to press harder.
It doesn’t mean a decline has to start now.
It means the advance has become more dependent on borrowed exposure continuing to work.
Fast leverage growth can support the final stage of an uptrend. It can keep prices moving higher while trend, momentum, and confidence remain aligned.
The problem starts when leverage growth slows while price weakens.
It's when the feedback loop can reverse.
The same borrowing that added fuel on the way up can become supply on the way down.
It says the fuel is being added fast.
Margin Debt Isn’t A Clock
Margin debt doesn’t tell us the exact date of a market peak.
It doesn’t say the market has to decline next week, next month, or even this year. High leverage can stay high. Expensive markets can become more expensive. Momentum can keep working while cautious investors wait.
That’s why margin debt is weak as a standalone timing tool.
It’s better as a pressure gauge.
It tells us how much borrowed exposure may need to be unwound if the trend deteriorates.
It matters.
A highly levered market can keep rising because leverage adds buying power. But once the trend stops rewarding leverage, the payoff profile changes.
The same leverage that helped support prices on the way up can amplify selling pressure on the way down.
For ASYMMETRY®, the issue isn’t about predictive ability. It’s disciplined timing, predefined risk, and consequence control.
The market can still go higher.
The real question is whether the next unit of upside is worth the additional downside convexity now embedded in the system.
What Most Investors Miss
I get a lot of commentary asking for my thoughts. Most commentary gets stuck in a lazy debate.
One side says record margin debt is bearish.
The other side says margin debt doesn’t matter because it rises with the size of the market.
Both are incomplete.
The risk isn’t the record by itself.
The risk is the interaction between leverage, collateral, volatility, liquidity, and investor behavior.
Margin debt becomes dangerous when price weakness starts reducing borrowing capacity.
That’s when a normal decline can become a reflexive decline.
Prices rise, account equity rises, borrowing capacity expands, and more borrowed money can enter the market.
If the trend turns, the process can run backward.
Prices fall, collateral values fall, borrowing capacity contracts, investors reduce exposure, liquidity thins, volatility rises, and risk limits tighten.
Margin debt doesn’t cause every decline.
But when leverage is high, it can change the character of a decline.
A normal pullback can turn into an air pocket if the marginal seller is no longer choosing to sell, but being forced to sell.
The Strongest Opposing Case
The opposing case deserves respect.
Margin debt is high partly because the market is large. Household net worth is high. Corporate earnings have been resilient. Buybacks remain a major source of demand. Passive flows continue to support index exposure. AI-related capital spending and earnings expectations may justify higher risk appetite.
Volatility can also stay contained longer than skeptics expect.
In that environment, high margin debt may be less of an immediate warning and more of a confirmation that investors are willing to press a winning trend.
To me, it matters.
Borrowed exposure can fuel upside before it becomes a liquidation risk.
A high-leverage market can move farther than a low-leverage observer thinks is rational.
So the conclusion isn’t “margin debt is high, therefore sell.”
The conclusion is more precise:
The upside can continue, but the downside is now more convex.
Add this to increasing risks that suggest the market is getting fragile.
The market may still reward risk-taking. The penalty for being wrong has increased.
The Blind Spots
The first blind spot is scale.
Raw margin debt should be viewed against market capitalization, account equity, household net worth, and liquidity conditions. A trillion dollars of margin debt means something different today than it would’ve meant decades ago.
That doesn’t eliminate the risk. It keeps the analysis honest.
The second blind spot is borrower intent.
FINRA margin debt data doesn’t tell us exactly who is borrowing, why they’re borrowing, or whether the exposure is hedged. Some margin borrowing may be used for liquidity, tax planning, hedging, relative value trades, or temporary financing rather than outright speculation.
The third blind spot is hidden leverage.
FINRA margin debt doesn’t capture the full leverage stack. It doesn’t fully show options, futures, swaps, structured products, leveraged ETFs, securities-based loans, private funds, institutional financing, or embedded leverage inside other vehicles.
That cuts both ways.
Visible margin debt may overstate speculative risk if some borrowing is hedged.
But it may also understate total market leverage if more risk sits outside the reported series.
The fourth blind spot is timing.
Prior cycles show that deeply negative investor credit has often appeared before major equity peaks. But the sample size is small. The timing varies. It shouldn’t be treated like a countdown.
It’s more useful as a warning that the market’s shock absorbers may be weaker than they appear.
What Would Make This Warning Fail
This warning fails if the market keeps validating the leverage.
That means earnings keep supporting prices, liquidity stays available, volatility remains contained, credit spreads stay calm, and market participation broadens instead of narrowing.
It also means margin debt growth slows because portfolios appreciate, not because investors are forced to deleverage.
If free credit balances rebuild without meaningful price damage, today’s margin debt backdrop would look less like an immediate danger point and more like aggressive risk appetite inside a durable expansion.
That’s possible.
But it requires several things to stay favorable at the same time.
When leverage is high, the market has less tolerance for disappointment.
The Hidden Risk
The hidden risk isn’t a normal decline.
The hidden risk is forced de-risking.
Markets often look liquid when everyone wants to hold. Liquidity gets tested when investors need to sell.
Margin debt matters because it can convert price weakness into balance-sheet pressure.
That’s when the market’s character can change.
Investors who were confident at higher prices may become sellers at lower prices, not because they want to, but because account equity, broker requirements, or risk limits force the issue.
The more borrowed exposure exists, the more vulnerable the market becomes to the gap between perceived liquidity and actual liquidity.
That gap is where downside velocity lives.
Second-Order Effects
The first-order effect of margin debt is more buying power.
The second-order effect is greater sensitivity to volatility.
The third-order effect is behavioral compression.
When leverage is rising, investors feel confirmed. The trend validates the exposure. Gains increase confidence. Confidence supports more borrowing. More borrowing supports more demand.
When the trend weakens, the same investors can become more reactive. They’re no longer responding only to price. They’re responding to margin requirements, volatility, liquidity, account equity, and fear of forced liquidation.
That’s how confidence becomes constraint.
This is why margin debt should be read with price trend, volatility, credit spreads, market participation, leadership concentration, liquidity, and positioning.
By itself, margin debt is incomplete.
Together, these measures tell us when the market is becoming more dependent on borrowed confidence continuing to work.
The ASYMMETRY® Takeaway
Our three charts don’t say a bear market starts now.
They say the market is carrying more financed exposure, less cash cushion, and more downside reflexivity than most investors appreciate.
That matters because the next decline may not be driven only by opinion changing.
It may be driven by collateral values falling, borrowing capacity shrinking, and leveraged investors cutting exposure into weakness.
A market can keep rising with high margin debt. Borrowed exposure can fuel momentum longer than skeptics expect.
But once the trend stops rewarding leverage, the payoff profile changes.
Upside remains possible, but the downside can become faster, sharper, and less forgiving.
For ASYMMETRY®, this is a portfolio-risk signal, not a market call.
It argues for tighter attention to exit points, position size, hedge exposure, liquidity, and total portfolio risk before the market tests them.
When borrowed confidence becomes the marginal source of buying power, the mission isn’t to call the exact top.
The mission is to avoid being surprised by the speed of the unwind if the market stops rewarding leverage.
The market has more fuel.
It also has more accelerant.
My observation after tactically trading through trends since the 1990s is the market is climbing a mountain of glass. Enjoy the view and stay long to capture the final melt-up phase, but ensure your risk management systems are robust and your exit door is completely unblocked.
 Mike Shell is the founder and chief investment officer of Shell Capital Management, LLC, a registered investment adviser. He serves as portfolio manager of ASYMMETRY® Managed Portfolios, a separately managed account program with trade execution and custody provided by Goldman Sachs Custody Solutions.
ASYMMETRY® Observations are provided for general informational and educational purposes only. They do not constitute investment advice, a recommendation, or an offer to buy or sell any security or investment strategy. The content is not intended to be a complete description of Shell Capital’s investment process and should not be relied upon as the sole basis for any investment decision.
Any securities, charts, indicators, formulas, or examples referenced are illustrative and are not intended to represent actual client portfolios, recommendations, or trading activity. Past performance is not indicative of future results. All investing involves risk, including the possible loss of principal.
Opinions expressed reflect the judgment of the author at the time of publication and are subject to change without notice as market conditions evolve. Information is believed to be reliable but is not guaranteed, and readers are encouraged to independently verify any information before making investment decisions.
Shell Capital Management, LLC provides investment advisory services only to clients pursuant to a written investment management agreement and only in jurisdictions where the firm is properly registered or exempt from registration.