

The S&P 500 gained 15.20% in the second quarter. It’s the best quarter since the second quarter of 2020. If you stopped reading there, you’d think it was easy money.
It wasn’t. And understanding why it wasn’t is the difference between owning risk and managing it.
Let’s start with what actually happened. June opened with a sell-off in technology stocks. Anxiety over inflation. A hawkish Fed. The VIX, which measures how much movement the options market expects from the S&P 500 over the next thirty days, spiked to 22.22 on June 10th. Below 15 is calm. Above 20 means investors are paying up for protection because they’re worried. Then a framework to reopen the Strait of Hormuz helped stabilize sentiment, and the index recovered sharply in the final trading week to close the quarter at new highs. The VIX finished at 16.45, back down in quiet territory.
So the quarter’s headline number looks calm. The path to it wasn’t. And the path is everything, because we don’t get to invest in the finish line. You’d have to hold on through the whole ride.
Here’s what most investors miss when they see that 15% and feel like they’re missing out: the index took 100% of the risk, 100% of the time, to get it. The S&P 500 is long-only and fully invested. Always. It has no exit strategy. It has no stop loss. It has no concept of “enough.” When the VIX ran to 22 in the second week of June, the index didn’t reduce exposure. It couldn’t. It rode straight through the drawdown fully exposed, the same way it rode through 2022 fully exposed, the same way it rode through 2008 fully exposed, losing more than half its value. The index doesn’t manage risk. It just holds it. When you buy the index, that’s the deal you’re signing: all the reward requires accepting all of the risk, all of the time.
That deal works fine until it doesn’t. And this quarter, underneath the calm surface, the market was telling us something about how quickly it could stop working.
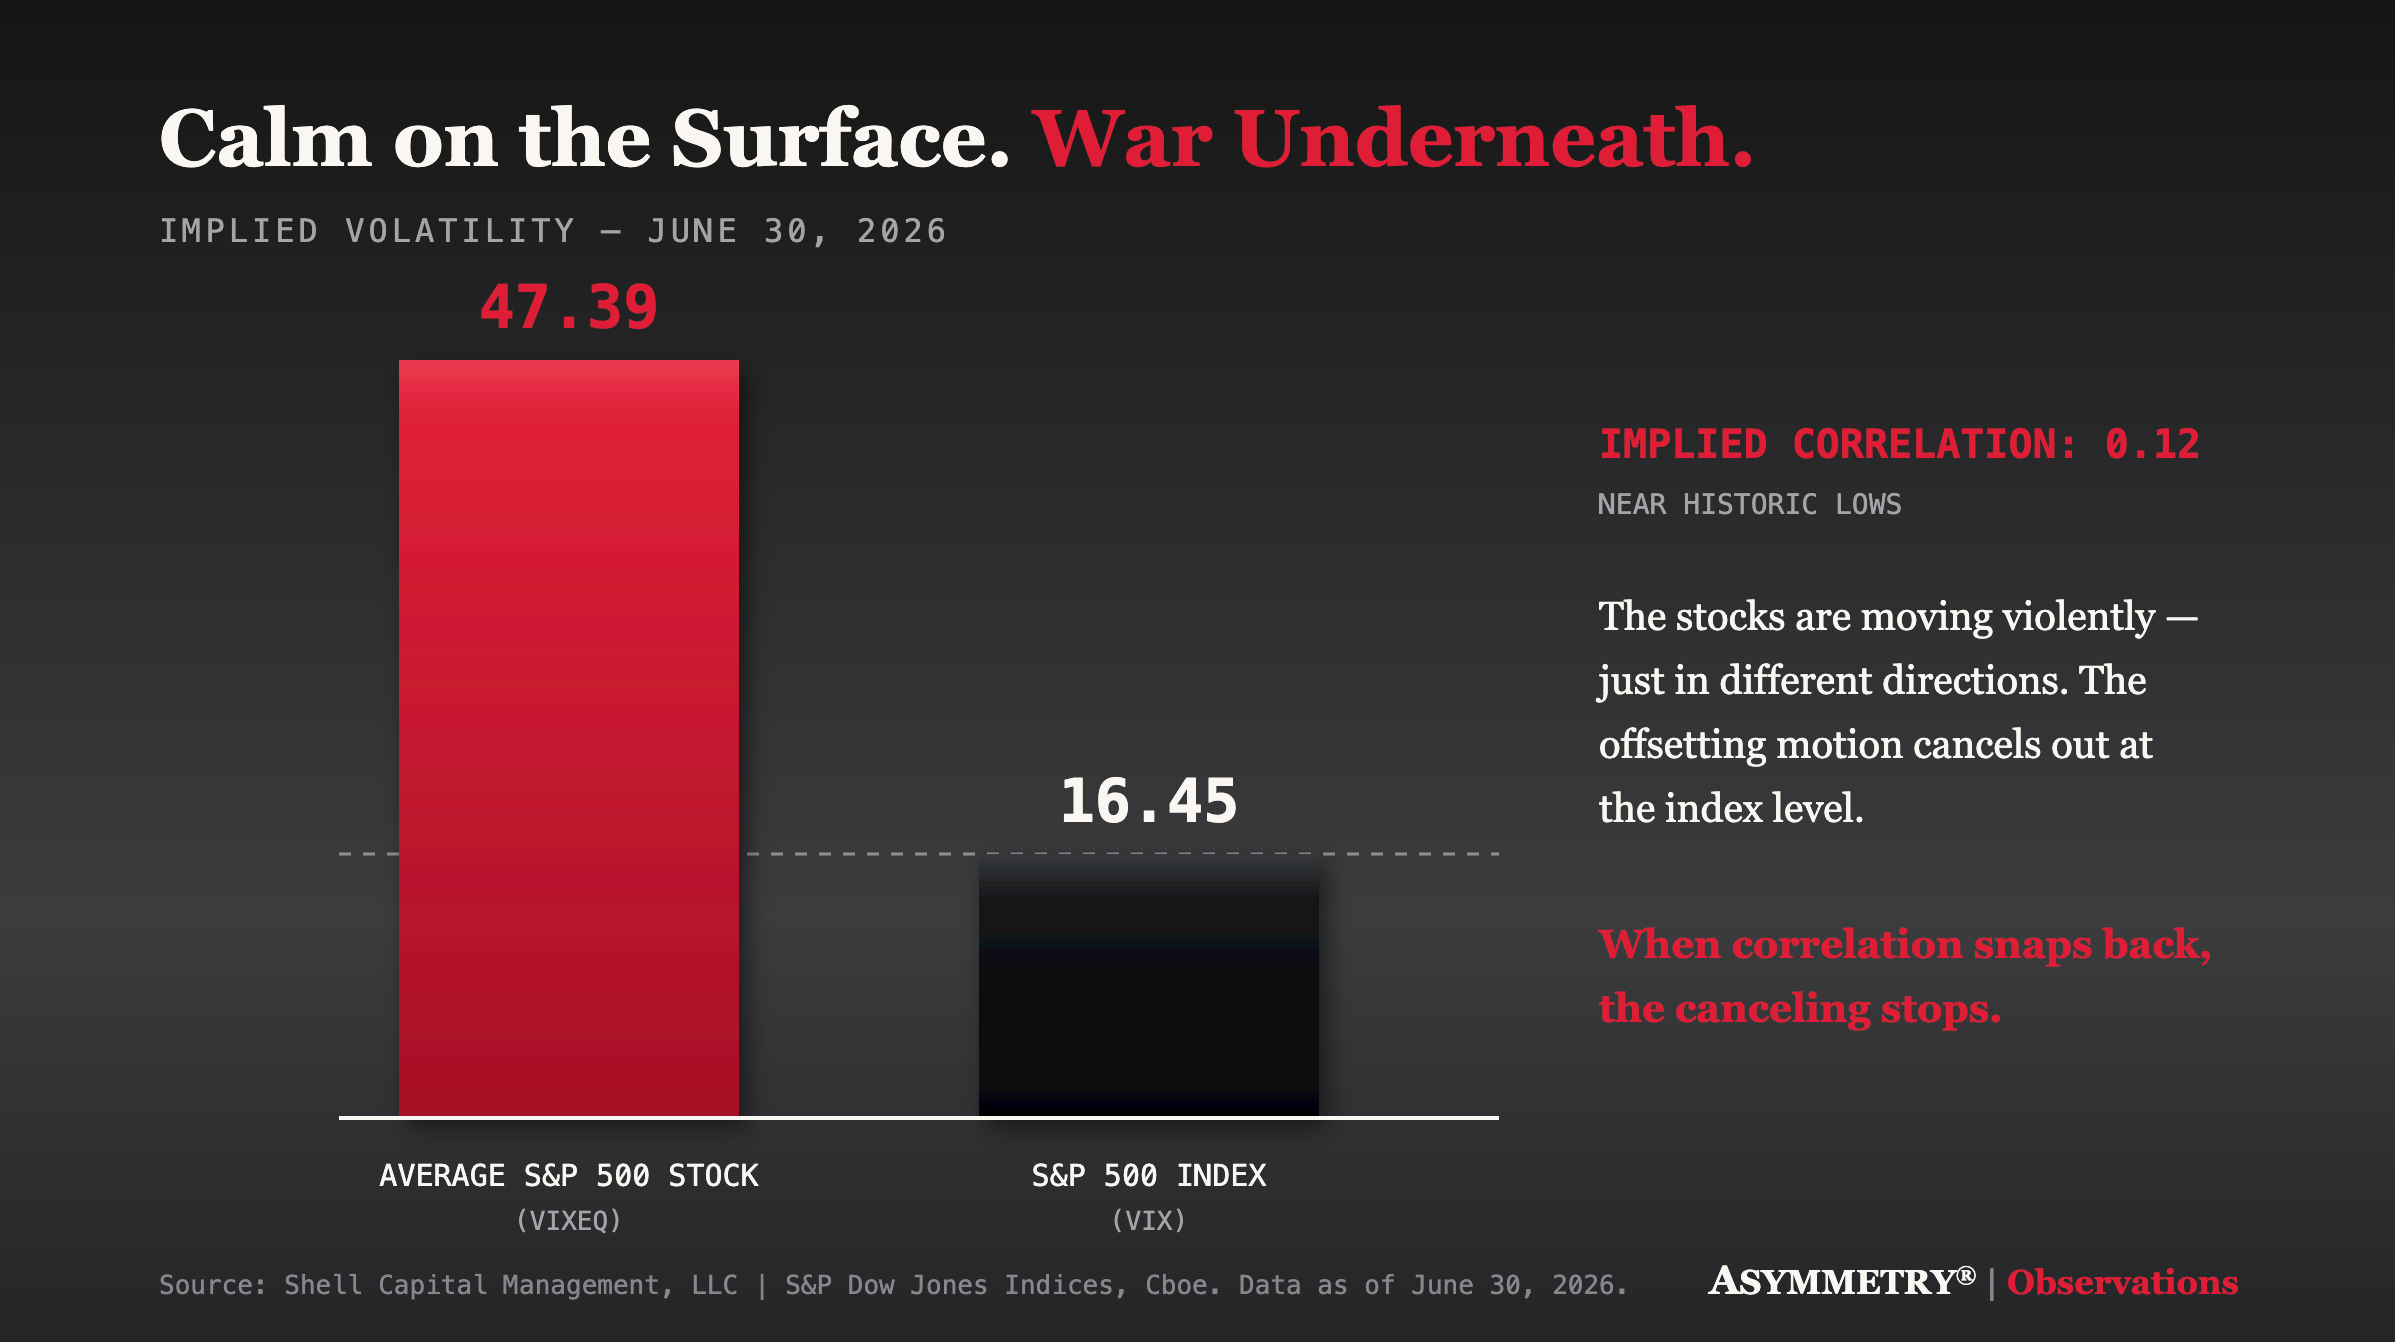
Look at what happened inside the index. The Cboe S&P 500 Dispersion Index, which measures how differently individual stocks are expected to move from one another, closed the quarter at 44.44, a one-year high. Higher means the gap between the winners and the losers is widening. Here’s what that looks like in plain terms: the average individual stock in the S&P 500 is priced by the options market to swing roughly 47% over the next year. The index itself is priced to swing just over 16%. How can 500 stocks that volatile produce an index that quiet? One number explains it: implied correlation sits at 0.12, near historic lows. Correlation runs from zero to one. At 1.00, every stock moves together. At 0.12, they’re nearly independent, moving violently but in different directions, and the offsetting motion cancels out at the index level.

Broadcom beat earnings and fell anyway, because guidance couldn’t clear elevated expectations. Micron reported blockbuster results, and semiconductors ripped. Two stocks, same industry, same month, opposite outcomes. That’s dispersion. The index averaged those wars into a calm number and moved on. Anyone holding one of those stocks with real size didn’t experience calm. They experienced the war.
This is why I keep saying the index level is an average, and averages hide risk. A calm index built on violent stocks isn’t a calm market. It’s a diversified one, for now. Correlation is the least stable statistic in finance. When stress arrives, correlations converge toward one, the offsetting stops, and all that single-stock volatility shows up at the index level at once. The passive investor finds out the calm was borrowed, not owned.
Now the part that matters for how we’re positioned.
S&P 500 Momentum gained 44.41% in the second quarter. The momentum factor, applied to the same 500 stocks, nearly tripled the index’s gain. Meanwhile, the S&P 500 Low Volatility gained 3.05%. Same index. Same quarter. Same stocks. A spread of more than 41% between the strongest factor and the weakest in ninety days. That spread is the signature of a market rewarding stock selection and trends and punishing indifference. When dispersion is this high and correlation is this low, what you own matters enormously more than whether you own.

The rotation confirmed it. The fifty largest stocks in the S&P 500 fell nearly 5% in June and gained only 3.84% for the year, while small caps gained 19.70% in the quarter and mid-caps gained 14.47%. The equal-weight S&P 500 told the same story from the other direction: it lagged the cap-weighted index by 4% for the quarter, then flipped and beat it by 3% in June alone. Money moved away from the hyperscalers and toward chipmakers, quality, and the broader market. Healthcare gained 6.62% in June. Industrials gained 7.29%. This is what a leadership change looks like while it’s happening. Momentum isn’t a static list of stocks. It’s a process that follows the strength wherever it migrates, and this quarter it migrated.
Even inside the winners, concentration remains the index’s quiet risk. Information Technology gained 31.79% for the quarter and contributed roughly two-thirds of the index’s entire gain. One sector carried the load. And look at what that sector actually is. The average technology stock is priced to swing nearly 49% a year, roughly three times the index itself. Its beta is 1.67, meaning when the market falls 10%, technology tends to fall closer to 17%. And it trades at more than 34 times earnings, so investors are paying $34 today for every dollar of current profit. The highest volatility, the highest beta, and the richest valuation of all eleven sectors. The index’s largest exposure is also its most volatile, its most sensitive to a downturn, and its most expensive. Over the past twelve months, simply being underweight that one sector cost the equal-weight version of the index roughly 20%. One sector explains nearly the entire difference between owning the market and owning it equally. The passive investor is making an enormous sector bet whether they intended to or not, with no plan for what happens if the AI earnings the market keeps reassessing ever fail to clear the bar. June 10th was a preview of what that reassessment feels like.
Commodities told the other side of the path-dependency story. The S&P GSCI Energy index lost 17.02% in the quarter and is still up 51.66% for the year. Anyone who bought that headline gain late in its run just experienced why we define the exit before the entry. What a trend gives on the way up, it takes back fast when it turns, and the only investors who keep asymmetric gains are the ones who decided in advance where they’d stop giving them back.
High dispersion means the opportunity for stock selection is as rich as it’s been in a year. Low correlation means index options are cheap relative to the violence in the underlying stocks, which means convexity, the right to a payoff without the obligation of the risk, is on sale. Strong momentum means trends are trending and worth riding. And a fully invested, never-selling index means the crowd is carrying maximum risk into all of it with no plan for the day correlation snaps back.
We don’t operate that way. Every position we hold has a predefined exit. Risk per position is capped. Total portfolio heat is capped. We ride the momentum while it’s paying, and we’ve already decided, in advance, exactly what would take us out. Positioned for the upside the market is offering, with the downside truncated before it ever gets the chance to compound.
The index had a great quarter riding all of the risk, all of the time, and it’ll do the same thing in the next bear market. So if you’ve made it this far, you can probably see why we predefine our exits, cap our risk, and let the trends pay us while they’re trending.
Mike Shell is the Founder, President, and Chief Investment Officer of Shell Capital Management, LLC and the portfolio manager of ASYMMETRY® Managed Portfolios.
Leave a Reply