
Nothing Like a Price Trend to Change Investor Sentiment
The sharp uptrend breakouts make investors more optimistic about the stock market, but though strong momentum is bullish, it may be an overreaction.


The sharp uptrend breakouts make investors more optimistic about the stock market, but though strong momentum is bullish, it may be an overreaction.

China balloon and the new changing world order

Natural gas, known as nat gas on the street, has crashed down along with heating oil.

The objective of a strangle is to capture the volatility premium inbedded in option prices, but with less risk than in a straddle, another established premium capture strategy.

Trend following with stop loss vs. call option

Trend following is a directional trading strategy that uses price-based "technical" indicators to identify trends with the objective to gain exposure to the direction of the price trend, expecting the trend to continue.

Using average directional movement to determine trend direction and strength.


TailDex® is a measure of the market’s expectations for an extreme event, often called a “tail event” or a “black swan,” which is a drop of at least three standard deviations.
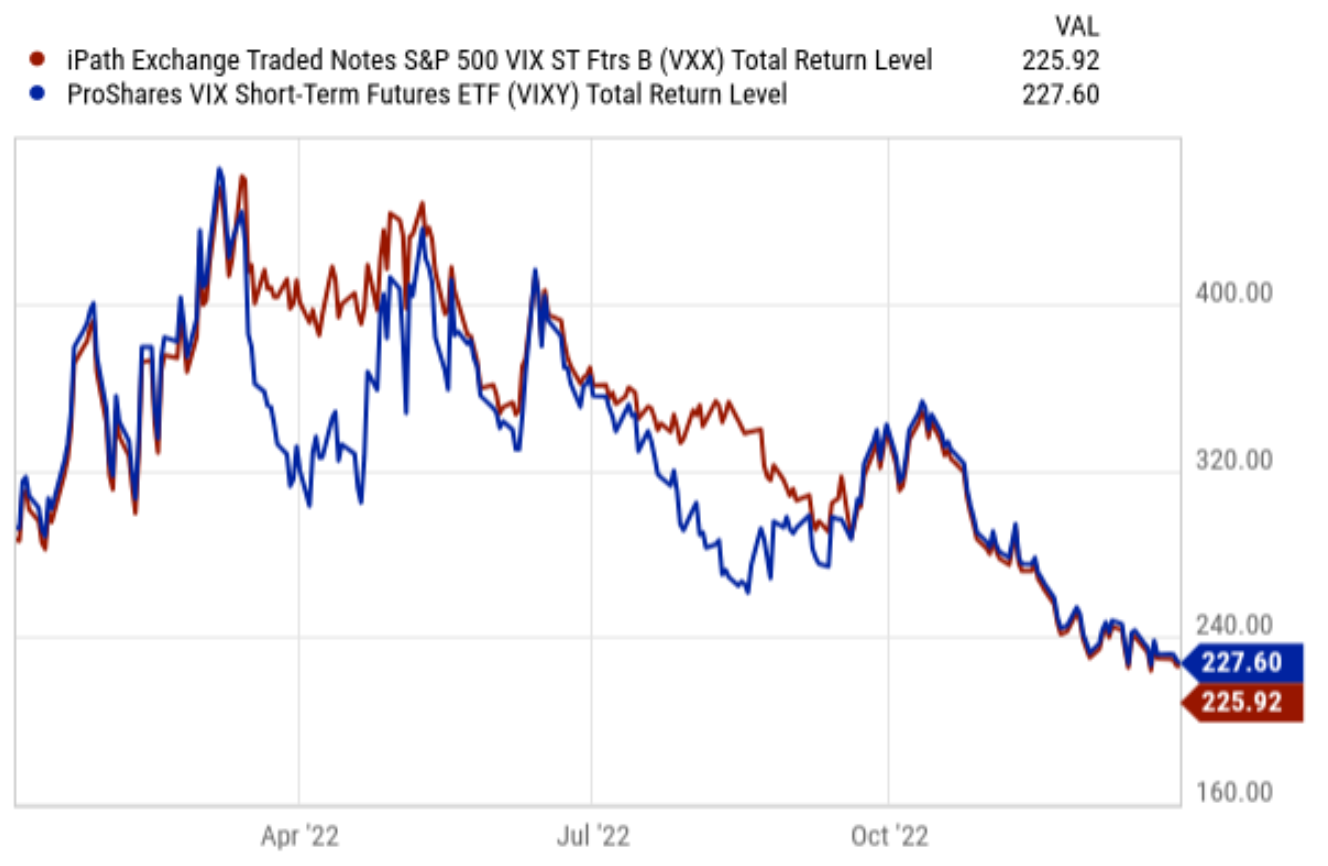
VXX and VIXY usually move in tandem due to their similar tracking of VIX futures, but in 2022, Barclays' suspension of new VXX issuance created an unprecedented divergence. The March 2022 event highlighted the risks of trading ETNs versus ETFs—while VIXY functioned properly throughout the year, VXX became detached from reality, trading at a significant premium before finally reverting.

Be a trend follower; always sell what shows you a loss and keep what shows you a profit.

When short-term interest rates fall, we can expect the dollar may fall.
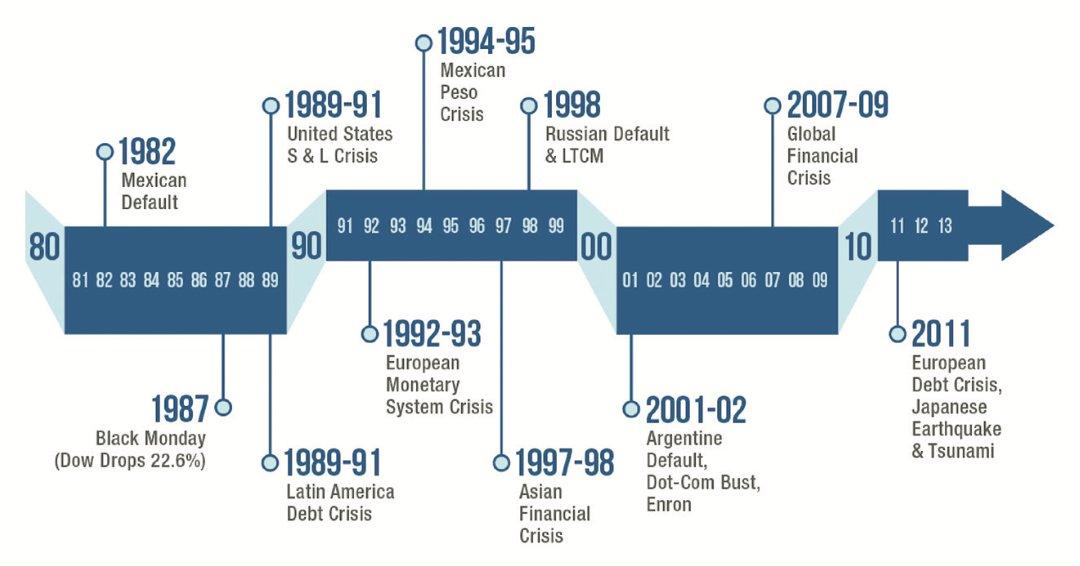
Financial crises occur about once a decade, with each one getting larger than the last.
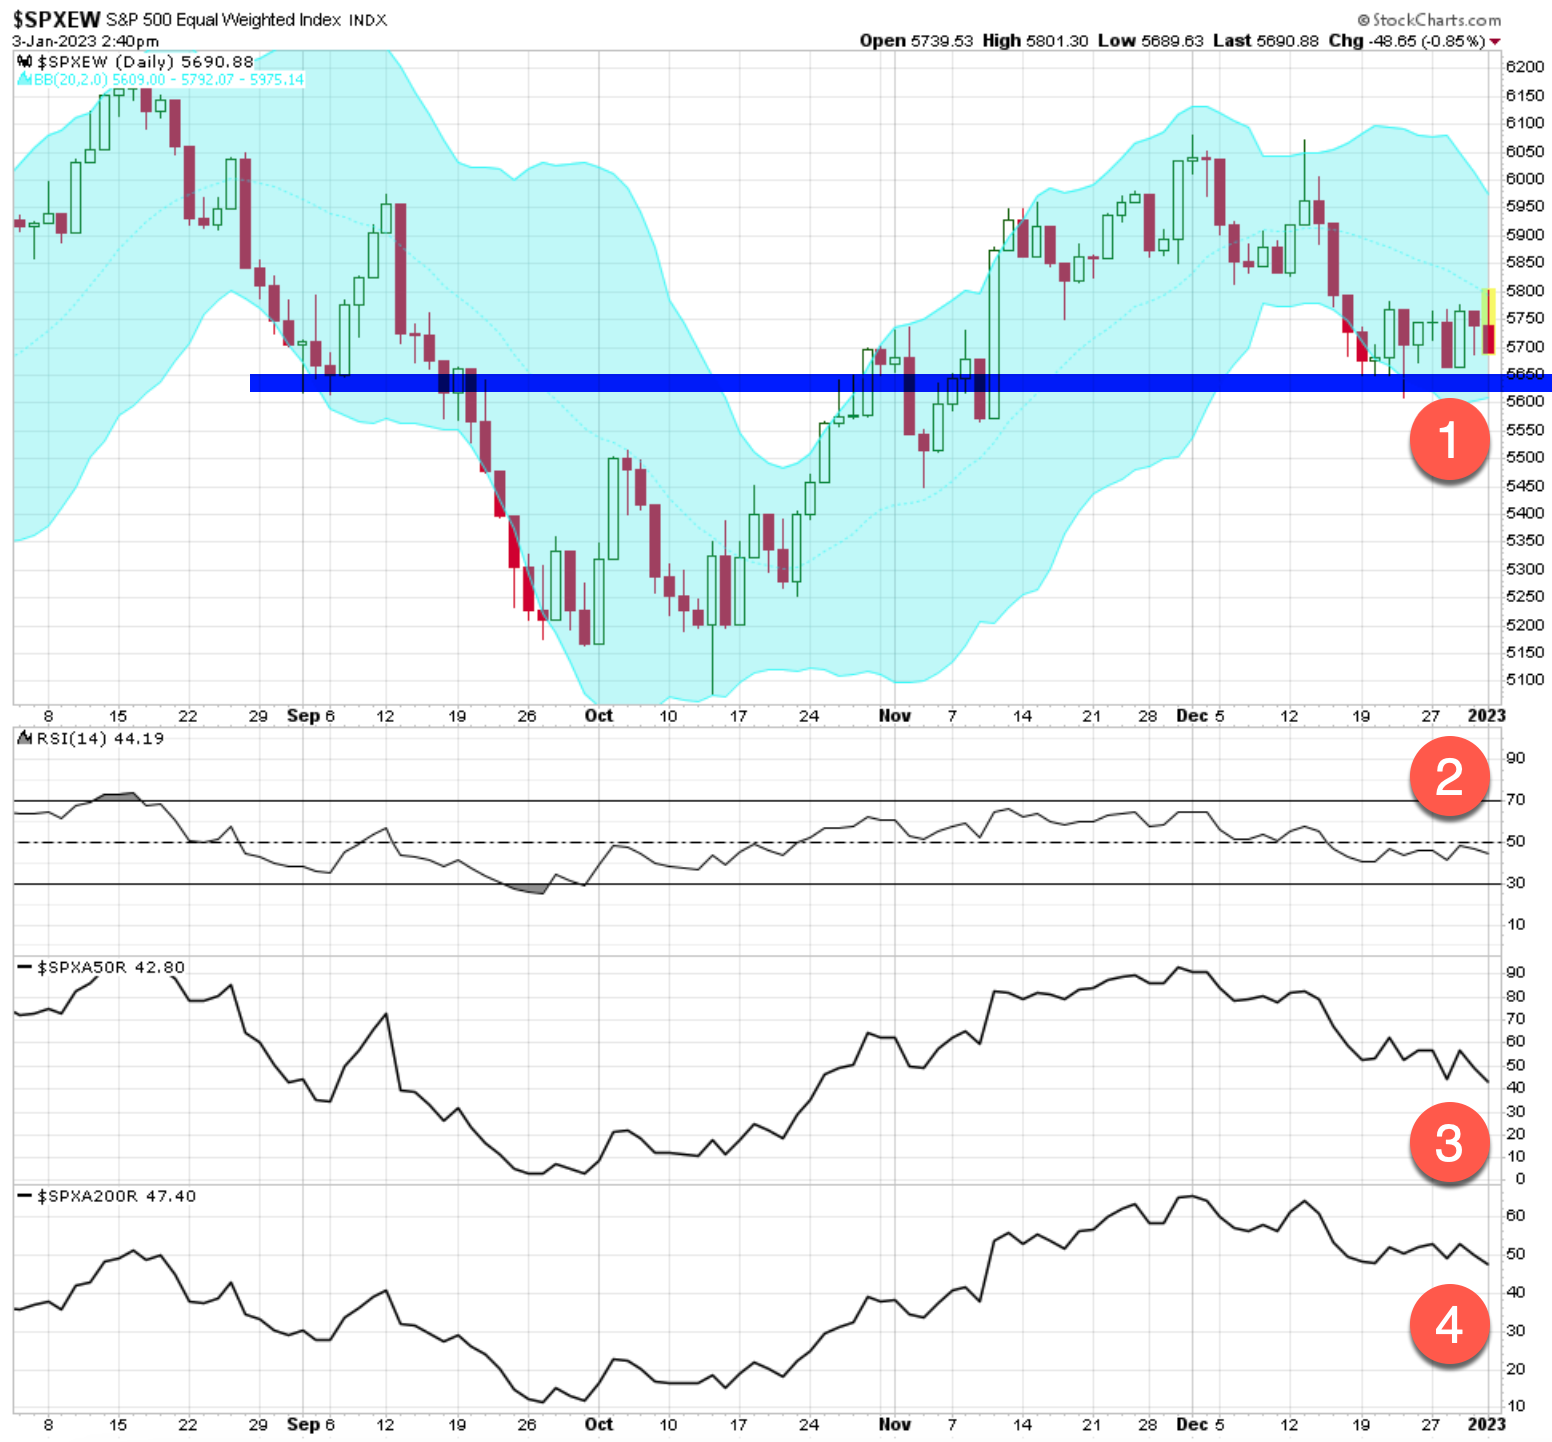
Trend analysis of the U.S. stock market trend using the S&P 500 Equal Weight Index

US Pending Home Sales Crash By Most On Record

The stock market, as measured by the S&P 500, needs to hold this key level to retain the short term uptrend.

JP Morgan's outlook focuses on three very different scenarios, with a baseline (40% probability) of seeing the building drag from an expected 5% fed funds rate and a rising US dollar as sufficient to tip the economy into a mild recession late next year.

The flash PMI data for November disappointed and looked pretty pessimistic.

Liquidity drives returns and the damage is not done yet

The global yield curve is indicating a recession for the first time in two decades.