
A Volatility Expansion for the Record Book
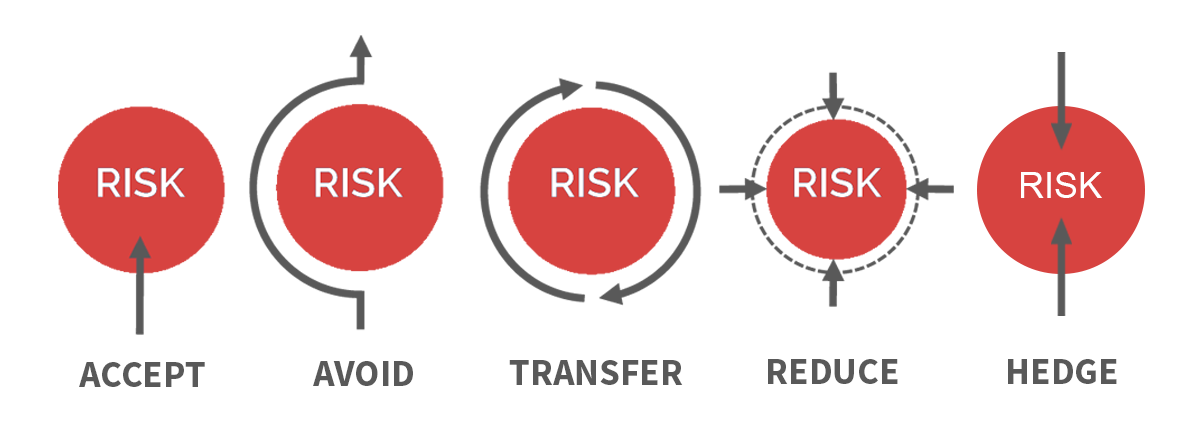
An asymmetric hedge structures an investment hedge to offset risk in other holdings with an asymmetric payoff such that the potential profit from the hedge is materially greater than the amount of risk taken to achieve it.