
Asymmetry in Sector Dispersion: Q1 2025 U.S. Sector Dashboard Insights
The March 2025 U.S. Sector Dashboard from S&P Dow Jones Indices provides valuable signals for investors seeking asymmetric opportunities through sector-level positioning. Dispersion and factor tilts are increasingly important in a regime where correlations are rising, yet sector performance diverges significantly.

Here’s what stands out for asymmetric positioning going forward.
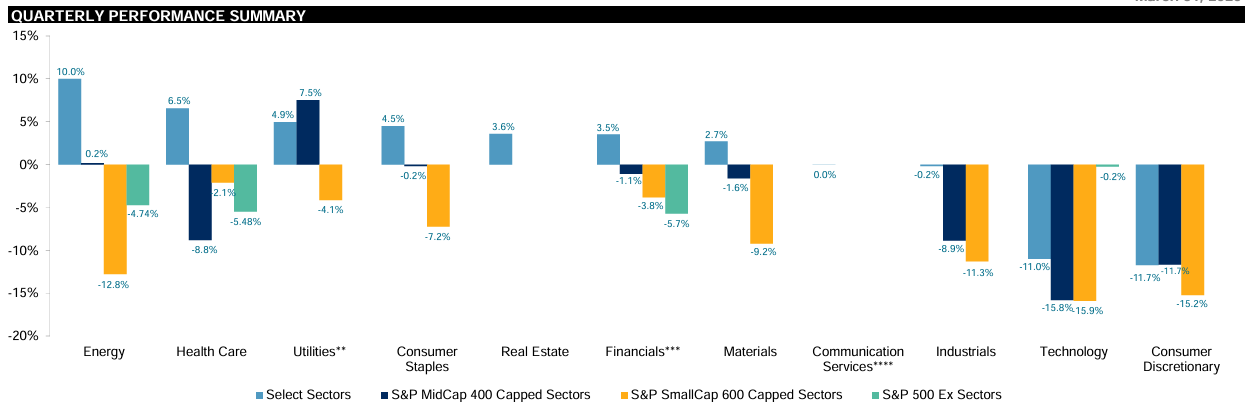
‒ Energy and Health Care showed leadership in Q1: The Energy Select Sector Index returned +9.98% and Health Care gained +6.54% for the quarter, supporting a defensive posture amidst broader market weakness. This sector divergence reveals where buying pressure concentrated while other sectors faced selling pressure.
‒ Technology and Consumer Discretionary were major laggards: The Technology sector fell ‒11.01% and Consumer Discretionary dropped ‒11.72% in Q1. Small- and mid-cap versions of these sectors were even weaker, indicating both valuation compression and potential liquidity issues.
‒ Dispersion increased across market caps: Particularly notable was the rise in dispersion for SmallCap Health Care and MidCap Consumer Staples. Rising dispersion suggests broader divergence in stock performance within sectors—a fertile condition for asymmetric strategies that exploit mispricings.
‒ Factor exposures show distinct shifts: Small-cap Consumer Discretionary had a high beta tilt and reduced quality and dividend exposure, while Utilities leaned toward low volatility and dividends across all market caps. These factor tilts can be used to structure trades aligned with macro themes like inflation, interest rate policy, or defensive demand.
‒ Sector correlations are rising—but not uniformly: Correlation among large-cap Consumer Staples and mid-cap Financials increased. This means broad diversification may be less effective. Investors seeking true diversification must now lean on asymmetric tactics that include defined downside.
‒ Valuation spreads are wide across sectors: Price-to-earnings (P/E) and price-to-book (P/B) ratios range dramatically—from Tech’s P/E of 37.8 to Energy’s 16.8. These valuation gaps can be exploited by pairing long/short exposures to structure trades with convexity and downside limits.
‒ RSI extremes show momentum breakpoints: Select sectors such as Consumer Discretionary and Technology have RSI levels below 36, potentially indicating short-term oversold conditions—but without confirmation from breadth or trend reversal, caution is warranted.
‒ Utilities and Energy offer high dividend yield with lower beta: Both sectors showed dividend yields over 3% and beta under 0.5. These metrics offer asymmetric appeal for yield-seeking investors looking to reduce market sensitivity.
‒ Sector-level optionality is growing: With dispersion up and cross-sector contribution to S&P 500 dispersion above average, the setup favors investors who actively allocate across sectors based on regime shifts—not passive diversification.
‒ What this means for asymmetric investors: Rather than seek exposure across all sectors, the goal is to identify where optionality exists—either through momentum, valuation dislocation, or factor tilt—and structure exposure with predefined exits or option overlays to cap downside and preserve convexity.
The Bottom Line
Sector dispersion is a gift to the asymmetric investor. When sectors diverge this sharply in trend, volatility, and valuation, the environment rewards those who are willing to rotate tactically and structure trades to capture exponential upside while controlling downside risk. We may use this data to identify setups with capped downside and high upside optionality—hallmarks of true asymmetry.