

Linear Regression Indicates Interest Rates Have Entered a New Higher Regime
Linear regression is a statistical method used to predict future trends from past data.
Similar to a moving average, quantitative investment managers may use simple linear regression to define when prices or levels are too high or too low.
In statistics, linear regression is a linear approach for modeling the relationship between variables. Linear regression analyzes two separate variables in order to define a single relationship.
When we apply linear regression to capital market trends we are are looking at price and time.
Below is a linear regression of the 10 year U.S. Treasury Yield, which is pushing up on 4.00% today, the highest level since 2008 on a monthly basis. TNX briefly reached 4.25% in October 2022. I used Barchart data to create the chart.
The black line is the yield, and the middle red line is the Linear Regression Line, a straight line that best fits the levels between a starting price point and an ending point. Best fit means the Linear Regression Line is where there is the least amount of space between the price points and the actual Linear Regression Line.
The Linear Regression Line is mainly used to determine trend direction.
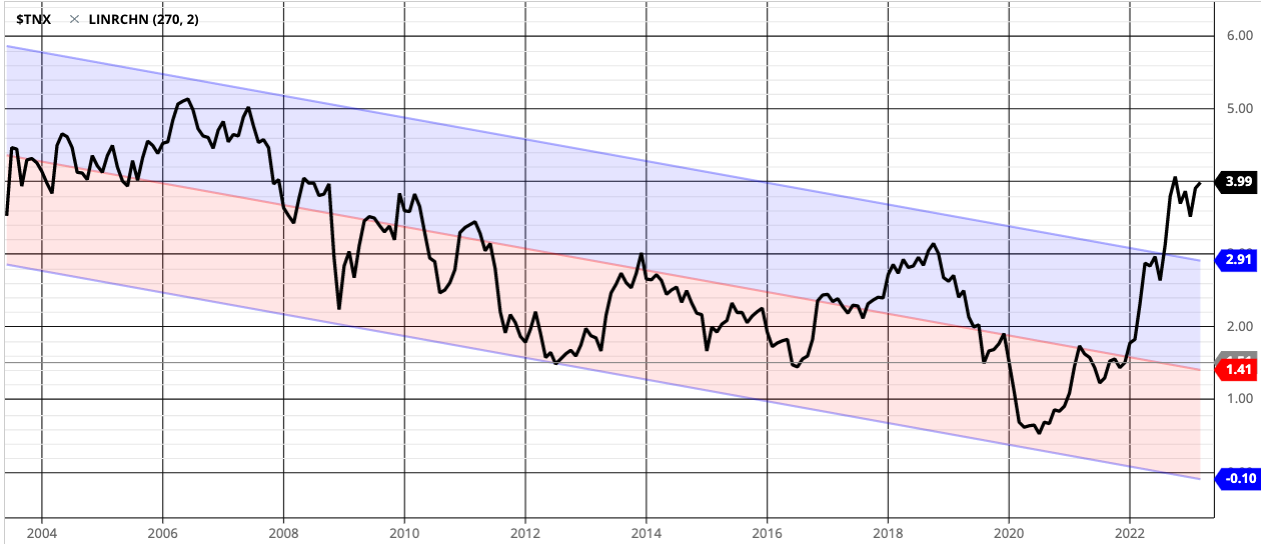
Clearly the trend has changed with the yield breaking out above the upper channel.
But what is the upper channel?
The Upper Channel Line is a line that runs parallel to the Linear Regression Line. In the above chart, it's two standard deviations above the Linear Regression Line.
The Lower Channel Line runs parallel to the Linear Regression Line and is two standard deviations below the Linear Regression Line.
The upper and lower channel lines contains 95% of all prices when 2 standard deviations are used.
When a trend breaks outside of the channels, it suggests the prior trend could be ending, and that seems to be the case with the 10 Year U.S. Treasury yield.
When a trend moves outside of the Linear Regression Channel for long periods of time, it's interpreted as an early signal that the past trend may be breaking and a significant reversal might be near.
In addition to identifying trends and trend direction, the use of standard deviation gives traders ideas as to when prices are becoming overbought or oversold relative to the long term trend.
Looking at the chart again, where I marked 1 is when we first thought the trend was extended to the upside and likely to retrace, and it did for a short period, but since then it's moved back up to a higher high, well outside the normal range that should include 95% of the data at 2 standard deviations.
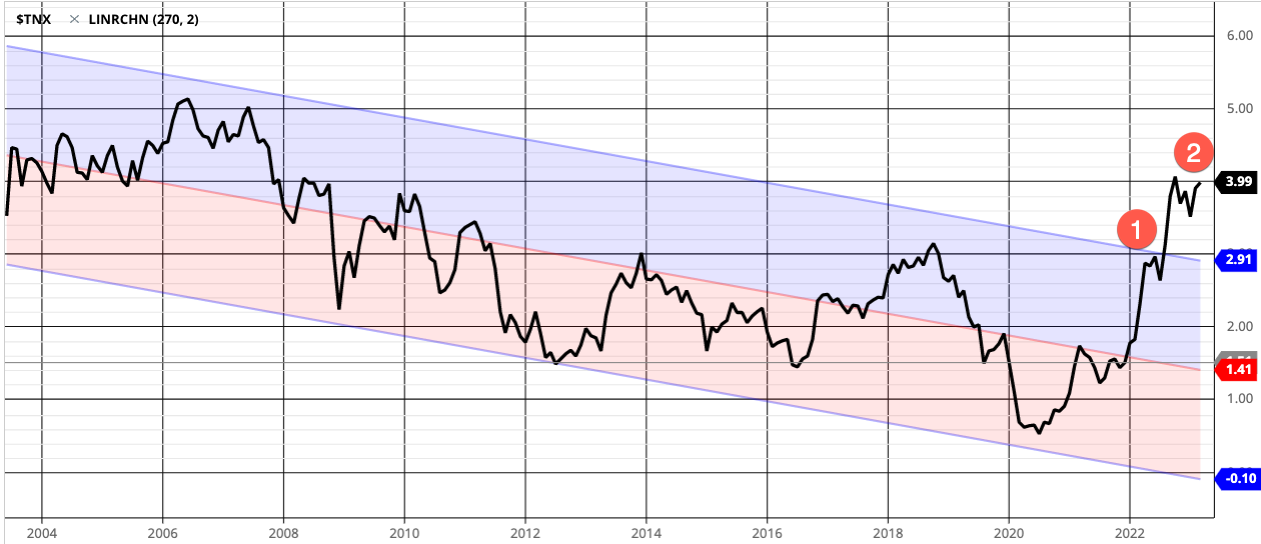
But, what about taking it out to 3 standard deviations?
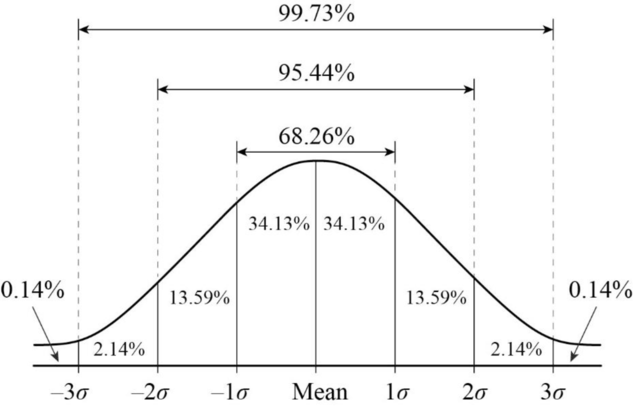
Here's the probability distribution as a graphical representation of a normal curve. If we look at 3 standard deviations, it should include 99.73% of observations.
Here's the Linear Regression of the 10 Year U.S. Treasury Yield using 3 standard deviations.
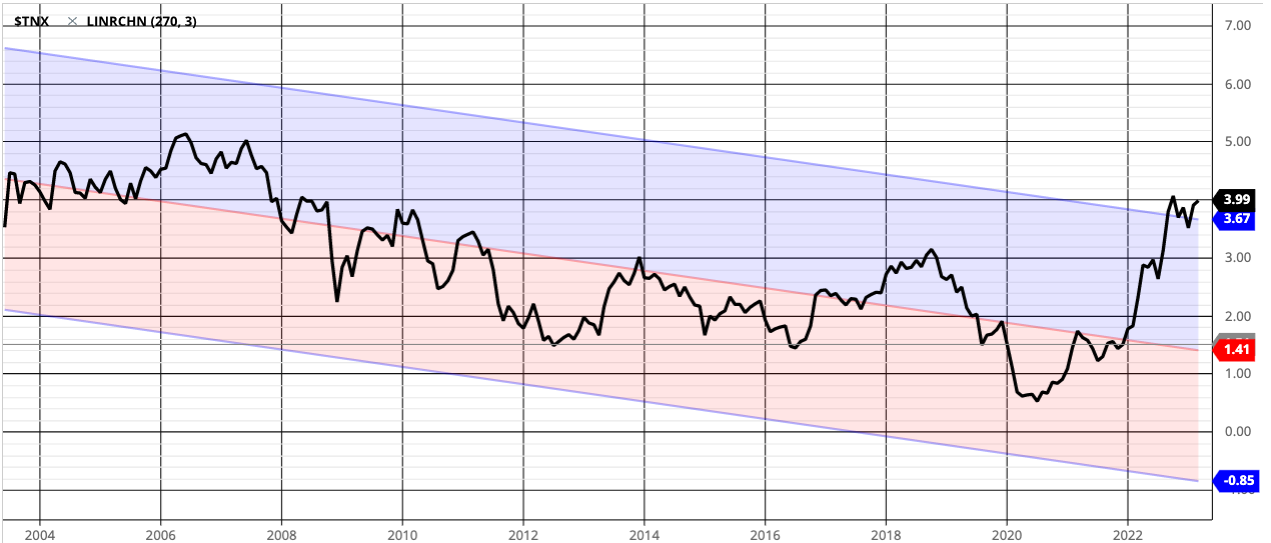
Yes, the directional trend of the e 10 Year U.S. Treasury Yield with 3 standard deviations shows the trend in interest rates has made a material breakout of its historical range of the past 270 months (22.5 years.)
I like to look at trends and think of "what has changed" and here we see a new regime until proven otherwise.

Mike Shell is the founder and Chief Investment Officer of Shell Capital Management, LLC, and the portfolio manager of ASYMMETRY® Managed Portfolios. Mike Shell and Shell Capital Management, LLC is a registered investment advisor focused on asymmetric risk-reward and absolute return strategies and provides investment advice and portfolio management only to clients with a signed and executed investment management agreement. The observations shared on this website are for general information only and should not be construed as investment advice to buy or sell any security. This information does not suggest in any way that any graph, chart, or formula offered can solely guide an investor as to which securities to buy or sell, or when to buy or sell them. Securities reflected are not intended to represent any client holdings or recommendations made by the firm. In the event any past specific recommendations are referred to inadvertently, a list of all recommendations made by the company within at least the prior one-year period may be furnished upon request. It should not be assumed that recommendations made in the future will be profitable or will equal the performance of the securities on the list. Any opinions expressed may change as subsequent conditions change. Please do not make any investment decisions based on such information, as it is not advice and is subject to change without notice. Investing involves risk, including the potential loss of principal an investor must be willing to bear. Past performance is no guarantee of future results. All information and data are deemed reliable but are not guaranteed and should be independently verified. The presence of this website on the Internet shall in no direct or indirect way raise an implication that Shell Capital Management, LLC is offering to sell or soliciting to sell advisory services to residents of any state in which the firm is not registered as an investment advisor. The views and opinions expressed in ASYMMETRY® Observations are those of the authors and do not necessarily reflect the position of Shell Capital Management, LLC. The use of this website is subject to its terms and conditions.