
Trend analysis of the U.S. stock market trend using the S&P 500 Equal Weight Index
For this trend analysis of the U.S. stock market trend, I'll use the S&P 500 Equal Weight Index as a proxy.
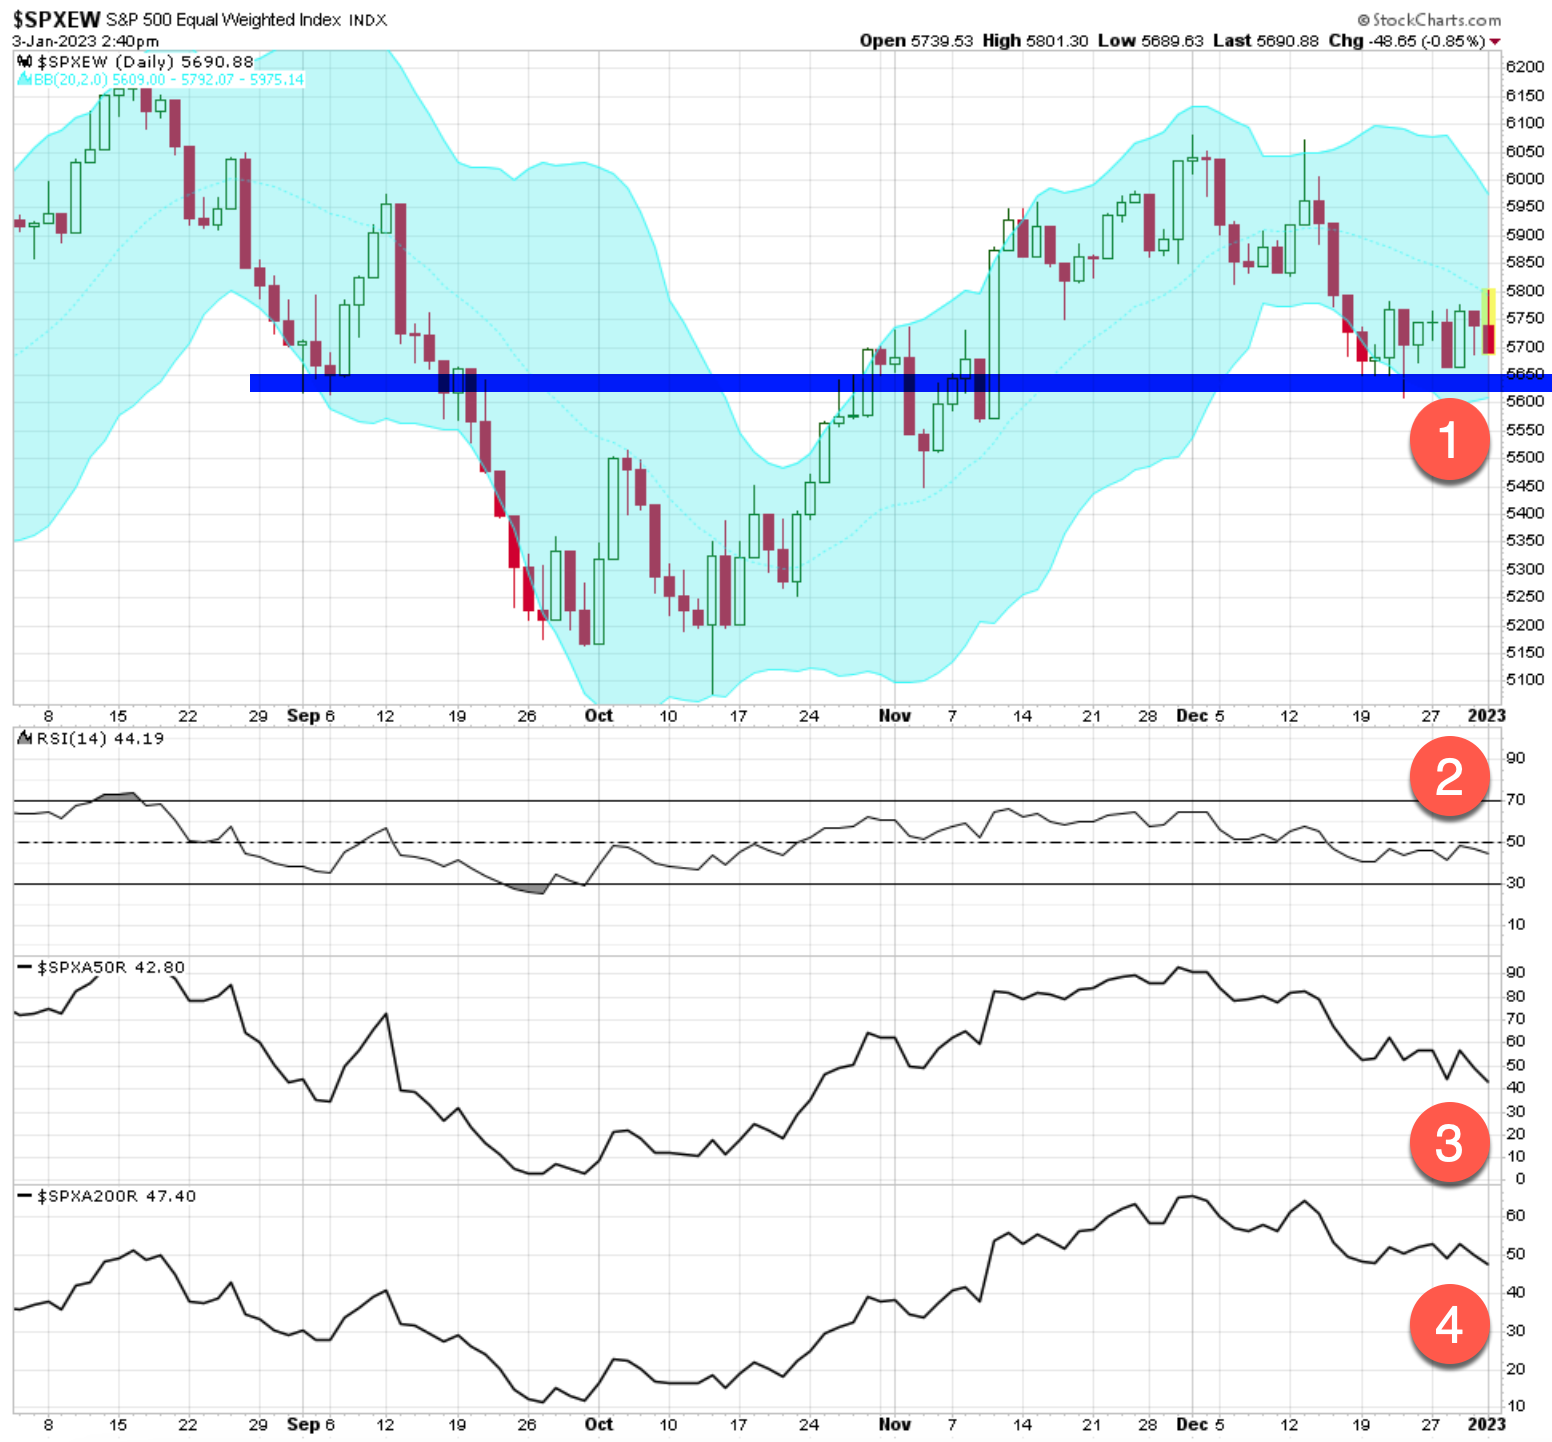
The S&P 500 Equal Weight Index equally weights the 500 stocks rather than sizing the holdings by market capitalization, which results in a heavy weighting in the larges 25 stocks. 
1. So far support at around 5650 as held, meaning the index has tapped this level a few times and bounced back up, suggesting there is enough buying demand around 5650 to hold it up, so far. However, if this level is broken, it increases the probability stocks fall more and continue the downtrend.
2. Not oversold: The relative strength as measured by RSI indicates the stock index is still far from oversold, and a lower-risk entry point.
3. Only 43% of the S&P 500 stocks are in a short term uptrend, as measured by the stocks trending above their 50 day price trend average. This suggests stocks have not yet presented an oversold washout we often see before a final bottom and reversal back up.
4. Only 47% above 200 SMA, not an oversold washout, same as #3.
What does this mean to me?
It's a slow grind down.
The stock index may not reach a new low before trending up to a new high, but if the recent price action continues it eventually will.
We remain on defense until the weight of the weight of the evidence suggests otherwise.
Mike Shell