

U.S. Sector Trend Following February 19, 2023
In yesterday's U.S. Stock Market Trend Following as of February 18, 2023, I looked at the trend direction and historical realized volatility of the S&P 500 stock index.
Let's look at individual sector trends by expanding from the broad index of 500 stocks by drilling down into each industry.
Sector trends drive the broader index as individual stocks move the sectors.
The S&P 500 (SPX) includes 11 sectors classified by the Global Industry Classification Standard (GICS), which separates companies based on their primary business activities.
We can use the sector indices to isolate trends and relative strength to identify the stronger sectors and separate them from the weak sectors.
The ranking of the 11 sectors based on weighting in the SPX is: Information Technology, Health Care, Financials, Consumer Discretionary, Communication Services, Industrials, Consumer Staples, Energy, Utilities, Real Estate, and Materials.
What is sector trend following, and why does it matter?
Sector trend following aims to identify the direction of the price trend of each of the 11 sectors and positon capital long the uptrends and out of (or short) the downtrends.
Applying our trend systems, we believe in getting more granular by gaining equity exposure through sectors to capitalize on the divergence between the return streams of the sectors. It helps to not only gain exposure to potentially profitable price trends but also avoid (or sell short) declining sectors.
After we determine the trend of the sector, we can then look inside the sector to find the best-performing stocks if we want.
Let's get to it, so you can get a glimpse of how we monitor these trends as well a few hundred other markets on a daily basis, systematically, and objectively based on quantitative evidenced based data.
As a reminder from yesterday's U.S. Stock Market Trend Following as of February 18, 2023, the SPX remains in an uptrend as we see in the chart I drew with data from Barchart. The S&P 500 is in an uptrend because the trend is higher lows and higher highs, and its above its own 25, 50, and 200 day average price.

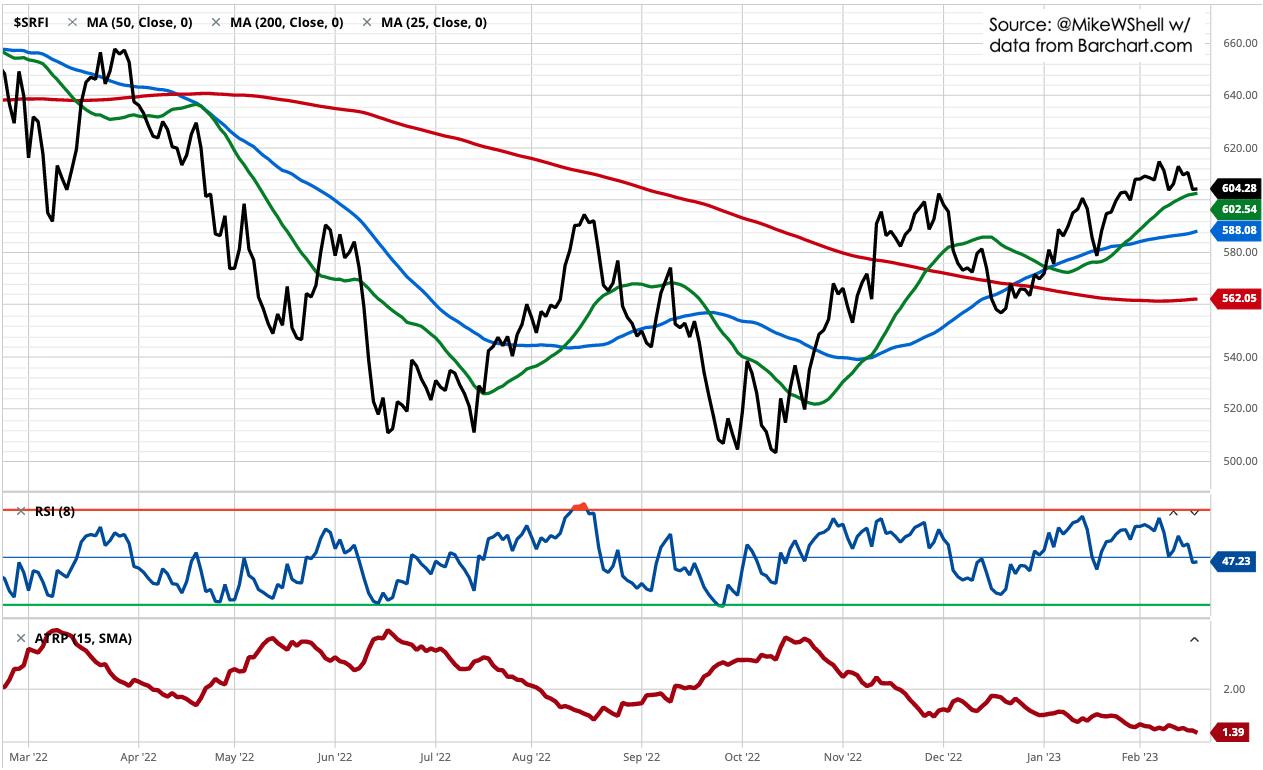
S&P 500 Consumer Discretionary Index has a heavy weighting in the SPX and its in an uptrend. For this first sector, I've labeled each observation.
1. The price is trending up with a higher low and higher high, and appears to be in the early stage of an uptrend as it recently crossed above its own 25, 50, and 200 day average prices.
2. When a market or sector is trending, we want to quantify its potential for continuation vs. a short term pullback, so for illustration purposes, we show the RSI, which is the Relative Strength Index that measures the velocity of the price trend the last 15 days for short term clues of momentum. Here we see the sector reached and overbought level three weeks ago (it hit the upper red line) and is currently at midfield like I said the SPX was yesterday. This tells me the sector has taken a break, and now it's set up to resume its recent uptrend or reverse down. The battled between buying enthusiasm and selling pressure will decide from here.
3. I've shared before we observe market states as being trending or non-trending, volatile or quiet. Like the S&P 500 we see the realized volatility as measured as an average of the true range over the past 15 days normalized into percentage shows the Consumer Discretionary sector is trading in a range of 2.3%, which is significantly more volatility than the 1.5% SPX. However, relative to its range over the past year it's at the low, so relatively speaking, its vol is relatively quiet.

You can probably see if we applied these methods to the sector, we'd want long exposure to see if the trend trend continues. To do that, I would predefine my risk with a predetermined exit price I'd sell if it instead trends down, but it it keeps trending up I would raise my exit to each new higher low, for example, to lock in profits, and lower our open risk exposure.
Consumer Staples is non-trending, but quiet.

The Energy sector is overall in an uptrend on the longer time frame, but non-trending more recently, but it's also nearly oversold.

The S&P Financials sector is in an uptrend across multi-timeframes with a volatility contraction.
The Healthcare sector joins the Staples sector in the non-trending category as it's below the shorter term trend markers but above the longer term. Heathcare and Staples are considered to be defensive sectors, so they seem to be consolidating with indecision as money is flowing to riskier sectors. Notice again realized vol is very low. I point that out because volatility contractions are eventually followed by volatility expansions. I'd be looking for a breakout in Healthcare.

Information Technology is by far the largest position size in the S&P 500 index at over 27% weight. In comparison, other sectors like Materials (2.7%) and Real Estate (2.7%) hardly matter. 
So, Technology is the big daddy, and despite a choppy few weeks, it's in a quiet uptrend, and its relative strength reflects the recent pause, so we're stalking for a breakout to either resume the short term uptrend, or the longer term downtrend.

Looking at the Industrial sectors, you'd have to wonder why there's so much fear of a recession. The stock market is not currently pricing in a recession, and here's a big sign. The Industrial sector has recovered most of its decline already. If there is a recession this year, it'll trend down much lower, but rather than trying to figure out what's going to happen next in the economy, we focus on what the market is already doing and it's telling us the market does not expect a recession. This also is a signal that a recession could shock the market that isn't pricing it in.

The Industrial sector is such an economically sensitive group I want to also show the same chart zoomed out to two years instead of one year. Industrials as a group have been cycling up and down for over two years without any upward progress, but at this point it's near its all time high.

The Basic Materials sector is essentially commodities, it includes companies in the chemicals, metals and mining, paper and forest products, containers and packaging, and construction materials industry. Materials is another cyclical group that's likely most sensitive to economic growth. Materias are in an uptrend, despite the recent non-trendiness, and vol is low.

The Communications sector was the weakest in 2022 as it was down -47% at the lows. It's been the weakest sector, but it's recently formed an uptrend across our multi-timeframe system. However, the sector shows so much dispersion of returns between the good and bad I've looked inside to find the stocks we want exposure, and to leave out those that aren't trending well.

I've changed the lookback period for two years from one year to show the volatility of the next sector, Real Estate. I told clients and friends Real Estate had peaked early 2022, and here's how I knew. RE is less than 3% weight in the SPX, but it's trying to maintain the recent uptrend, despite the headwind of rising interest rates that increase costs for the sector.

Overall, I notice many sectors seem to be spooled up for the next big move up or down.
Last but not least, the Utility sector is another underweight in the SPX index that's sensitive to interest rates partially because they borrow money and more so because they compete with bonds with since they are known for higher dividend yields. At this time, it's one of the only sectors that's in a downtrend. However, it recently entered what I consider a statistically oversold level, so we're stalking for a countertrend.

As many of these sectors are in the early stages of uptrends, you can probably see why we have exposure to select sectors and none in other non-trending sectors.
A few observations after looking at these trends is recent realized vol is at the lowest point of the past year, so I wouldn't be surprised to see another big directional move up or down.
We believe markets require active risk management and/or hedging, and our positive return last year when markets were down over 20% is the reward for our efforts.
Volatility contractions are eventually followed by volatility expansions, so let's see how it all unfolds from here.
I hope helps illustrate some of the ways we monitor the directional trends of the U.S. stock market and its sectors with an objective of identifying trend early in the stage to capitalize of the price momentum until it changes.

Mike Shell is the founder and Chief Investment Officer of Shell Capital Management, LLC, and the portfolio manager of ASYMMETRY® Managed Portfolios. Mike Shell and Shell Capital Management, LLC is a registered investment advisor focused on asymmetric risk-reward and absolute return strategies and provides investment advice and portfolio management only to clients with a signed and executed investment management agreement. The observations shared on this website are for general information only and should not be construed as investment advice to buy or sell any security. This information does not suggest in any way that any graph, chart, or formula offered can solely guide an investor as to which securities to buy or sell, or when to buy or sell them. Securities reflected are not intended to represent any client holdings or recommendations made by the firm. In the event any past specific recommendations are referred to inadvertently, a list of all recommendations made by the company within at least the prior one-year period may be furnished upon request. It should not be assumed that recommendations made in the future will be profitable or will equal the performance of the securities on the list. Any opinions expressed may change as subsequent conditions change. Please do not make any investment decisions based on such information, as it is not advice and is subject to change without notice. Investing involves risk, including the potential loss of principal an investor must be willing to bear. Past performance is no guarantee of future results. All information and data are deemed reliable but are not guaranteed and should be independently verified. The presence of this website on the Internet shall in no direct or indirect way raise an implication that Shell Capital Management, LLC is offering to sell or soliciting to sell advisory services to residents of any state in which the firm is not registered as an investment advisor. The views and opinions expressed in ASYMMETRY® Observations are those of the authors and do not necessarily reflect the position of Shell Capital Management, LLC. The use of this website is subject to its terms and conditions.