

Building on last week’s market insight, “The Trend Remains Up for the Stock Market, But Risk is Increasing,” here’s my latest observations of where things stand now.
The S&P 500 remains in an uptrend, but the latest price action confirms increasing risk and weakening trend strength.
Additionally, quantitative insights from the flow of funds data we monitor reinforce the heightened risk environment.
Trend Overview

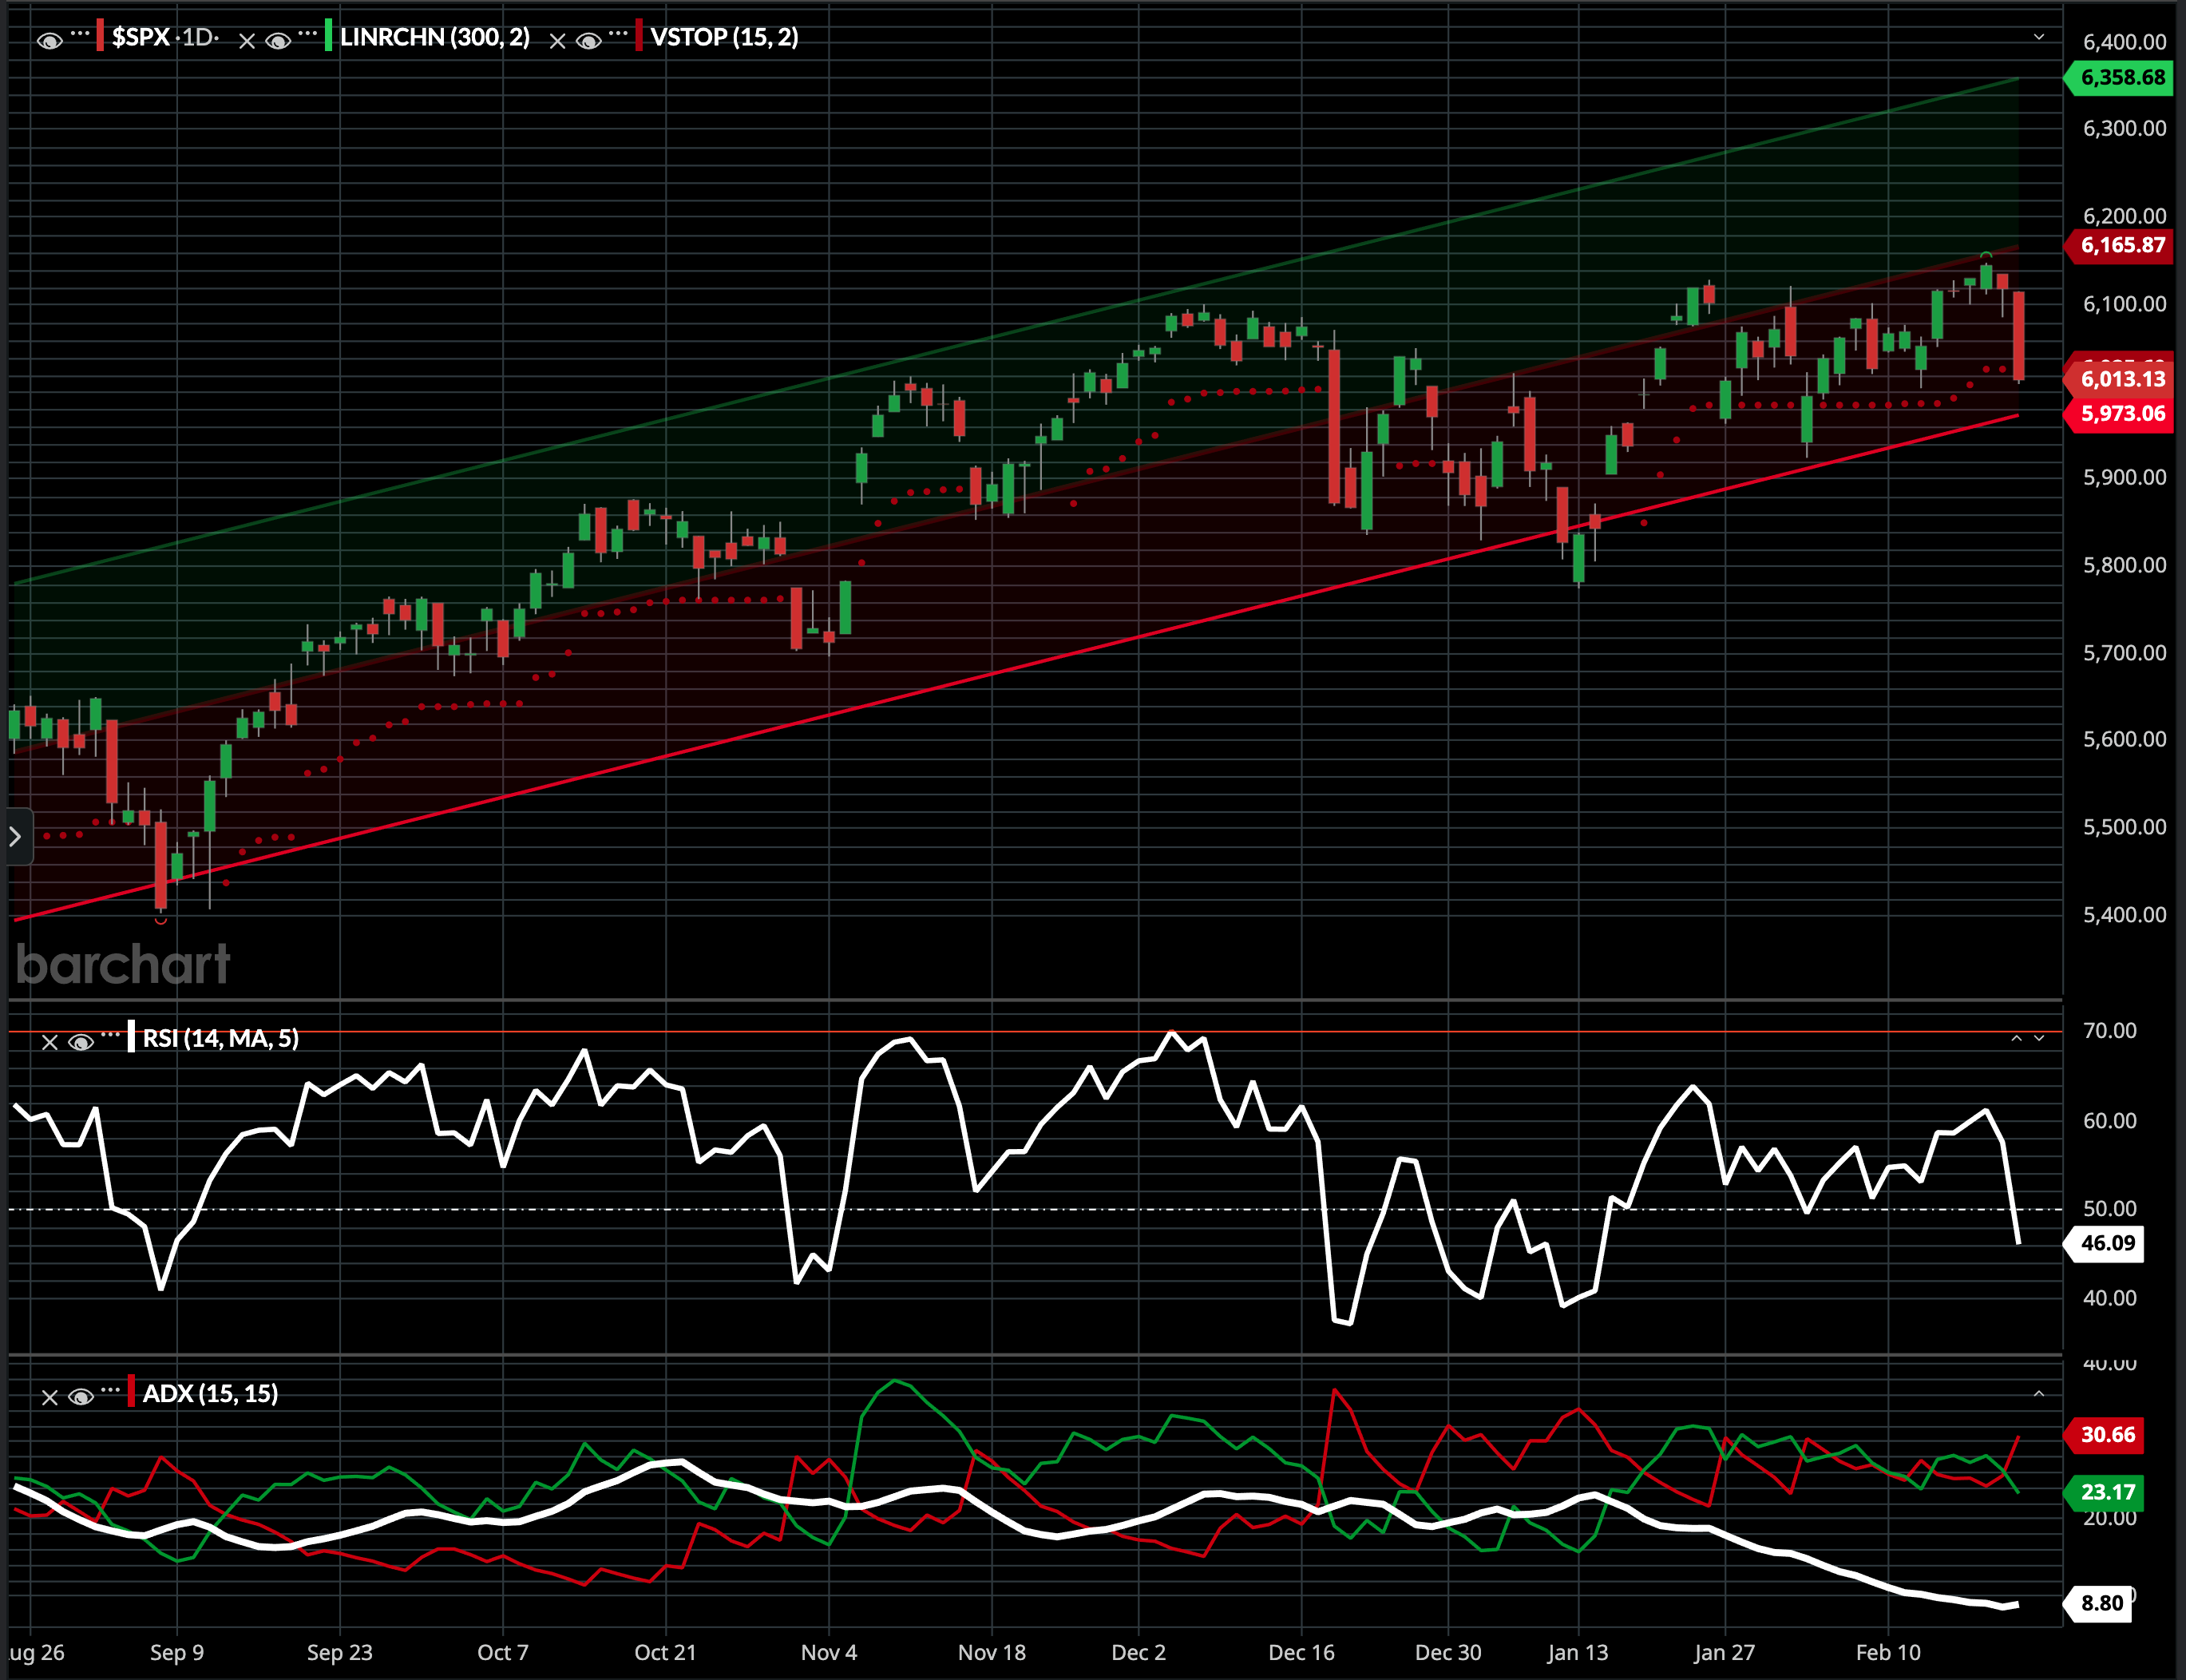
- Price Trend: The index continues to trade within an upward-sloping channel, but price is testing key support levels near 6,000. The lower bound of the channel (red trendline) remains intact, yet price is pressing against it—an early warning sign of potential breakdown risk if selling pressure persists.
- Volatility Exit & Risk Levels: The index has trended below the trailing volatility exit (red dots), signaling the market is now trading outside a normal range, indicating a volatility expansion.
- Relative Strength & Momentum Weakness: The Relative Strength is hovering around neutral (46.09), indicating neither extreme overbought nor oversold conditions. However, momentum has weakened over recent weeks, showing a lack of strong upside pressure.
- ADX & Trend Strength: ADX (white line) is declining, confirming a weakening trend. The +DI (green) and -DI (red) lines are converging, signaling an increasing battle between buyers and sellers. If the red line crosses above green with a rising ADX, it would indicate a strengthening downtrend.
Flow-of-Funds & Macro Factors Raising Risks
The flow-of-funds data we monitor outlines multiple factors that could impact market stability in the coming weeks:
Retirement Account Funding
We’ve just rolled past the seasonal period of heavy funding flows from retirement accounts.
Stock Buybacks
Corporate repurchasing is strong, but the blackout window starts mid-March.
Options Expiry Risk – $2.7 Trillion Notional
- Over $2.7 trillion of notional options exposure expired yesterday, including $1.2 trillion in SPX options.
- This massive expiration could remove hedging structures that have supported the market, leading to increased volatility.
Gamma Unclench Increases Market Volatility
- Dealers are currently long +$9.8 billion of S&P 500 gamma, acting as a stabilizer.
- 50% of this long gamma position rolled off yesterday, so price swings could spread out next week.
Low Realized Volatility Driving Vol-Control Strategies
- The 10-day realized volatility is at 8.8%, the lowest stretch of the year.
- Volatility control strategies have been increasing equity exposure, but if volatility spikes, these funds could start unwinding positions.
Liquidity & Market Structure
- Equity liquidity has been robust, with S&P 500 (ES1) futures showing $18M top-book liquidity, up significantly from $3.6M at the start of February.
- A shift in liquidity could amplify volatility and downside risk.
Stock Selection Over Passive Investing
- 1-month realized correlation is 6.69%, among the lowest levels in 5 years.
- This suggests a strong environment for active stock picking, but it also means passive funds could see increased volatility when broad market conditions shift.
Retail Demand Weakening
- Retail demand is starting to fade, aligning with the upcoming tax season, which could reduce speculative buying pressure.
NVDA Earnings on 2/26—Market Moving Event
- NVDA (6.55% holding in the S&P 500) has significant short gamma exposure via leveraged ETFs and options.
- The options market is pricing in a 9% move, equating to a $300 billion market cap swing.
- This event alone could trigger broader market turbulence.
Equity CTA Skew to the Downside
- Systematic strategies have an asymmetric downside risk, meaning if price weakens, forced selling could accelerate declines.
- Flow data shows that in a downturn, there could be $14.22 billion in selling over the next week and $173.12 billion over the next month.
Key Pivot Levels for SPX
- Short term: 6,042
- Medium term: 5,879
- Long term: 5,414
Asymmetric Positioning Considerations
- If the trend holds, maintaining long exposure with predefined downside risk remains viable, but the weight of the evidence indicates it’s less likely.
- A break below support (6,000) could signal risk-off positioning or hedging against downside exposure for those invested in stocks.
- Reducing exposure is prudent for the most nimble tactical traders like us, especially with NVDA earnings and post-OpEx volatility expected.
- A spike in volatility could trigger systematic selling, reinforcing the need for adaptive risk management.
While the S&P 500 remains in an uptrend, multiple warning signs suggest elevated downside risk.
Weakening trend strength, the expiration of massive options positions, and looming systematic flows have created an asymmetric risk-reward setup where downside risks outweigh near-term upside potential.
Remaining flexible and structuring positions asymmetrically will be critical in navigating this evolving market.
Mike Shell is the founder and Chief Investment Officer of Shell Capital Management, LLC, and the portfolio manager of ASYMMETRY® Managed Portfolios, a separately managed account program with trade execution and custody at Goldman Sachs Custody Solutions. Mike Shell and Shell Capital Management, LLC, a registered investment advisor focused on asymmetric risk-reward and absolute return strategies, and profivides investment advice and portfolio management only to clients with a signed and executed investment management agreement. The observations shared on this website are for general information only and should not be construed as investment advice to buy or sell any security. This information does not suggest in any way that any graph, chart, or formula offered can solely guide an investor as to which securities to buy or sell, or when to buy or sell them. Securities reflected are not intended to represent any client holdings or recommendations made by the firm. In the event any past specific recommendations are referred to inadvertently, a list of all recommendations made by the company within at least the prior one-year period may be furnished upon request. It should not be assumed that recommendations made in the future will be profitable or will equal the performance of the securities on the list. Any opinions expressed may change as subsequent conditions change. Please do not make any investment decisions based on such information, as it is not advice and is subject to change without notice. Investing involves risk, including the potential loss of principal an investor must be willing to bear. Past performance is no guarantee of future results. All information and data are deemed reliable but are not guaranteed and should be independently verified. The presence of this website on the Internet shall in no direct or indirect way raise an implication that Shell Capital Management, LLC is offering to sell or soliciting to sell advisory services to residents of any state in which the firm is not registered as an investment advisor. The views and opinions expressed in ASYMMETRY® Observations and Asymmetric Investment Returns are those of the authors and do not necessarily reflect the position of Shell Capital Management, LLC. The use of this website is subject to its terms and conditions.
Leave a Reply