
ASYMMETRY® Observations are Mike Shell’s observations of all things asymmetry, asymmetric risk/reward, asymmetric payoffs, and asymmetric investment returns.

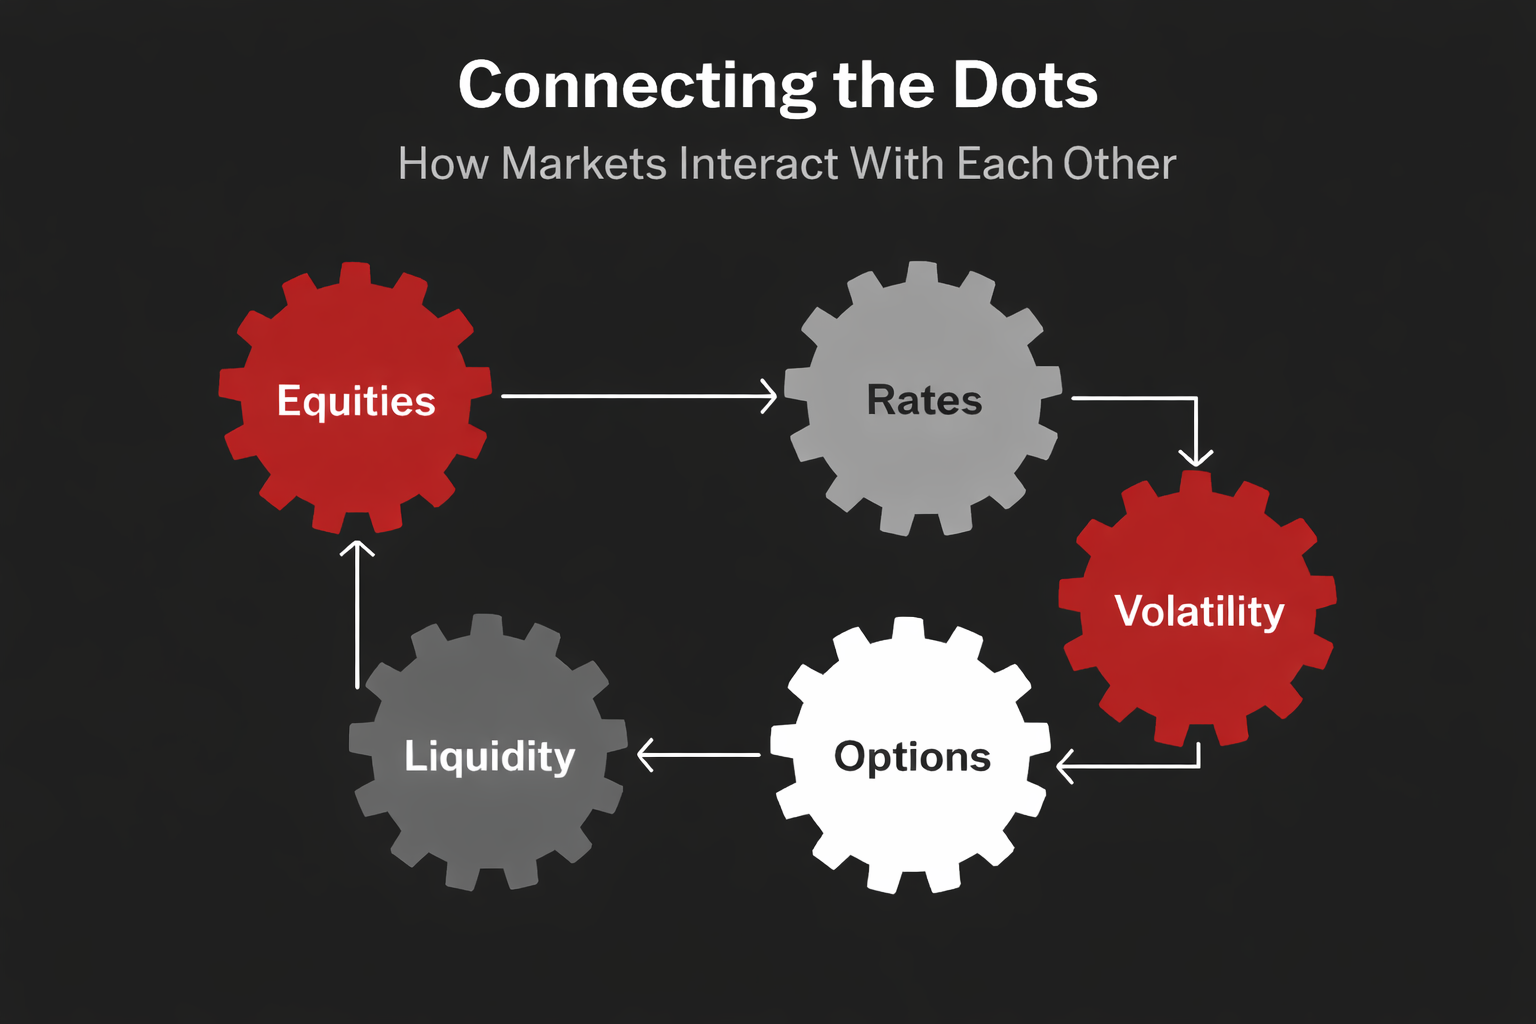
Markets don’t move in isolation. They interact. Equities, rates, volatility, options, and liquidity form a system where pressure in one area transmits into others. Understanding those interactions—who is forced to act, when risk accelerates, and where fragility builds—matters far more than predicting the next market move. Connecting the dots isn’t about forecasting outcomes. It’s about understanding how risk flows through the system—and structuring portfolios so downside is defined while upside remains open.
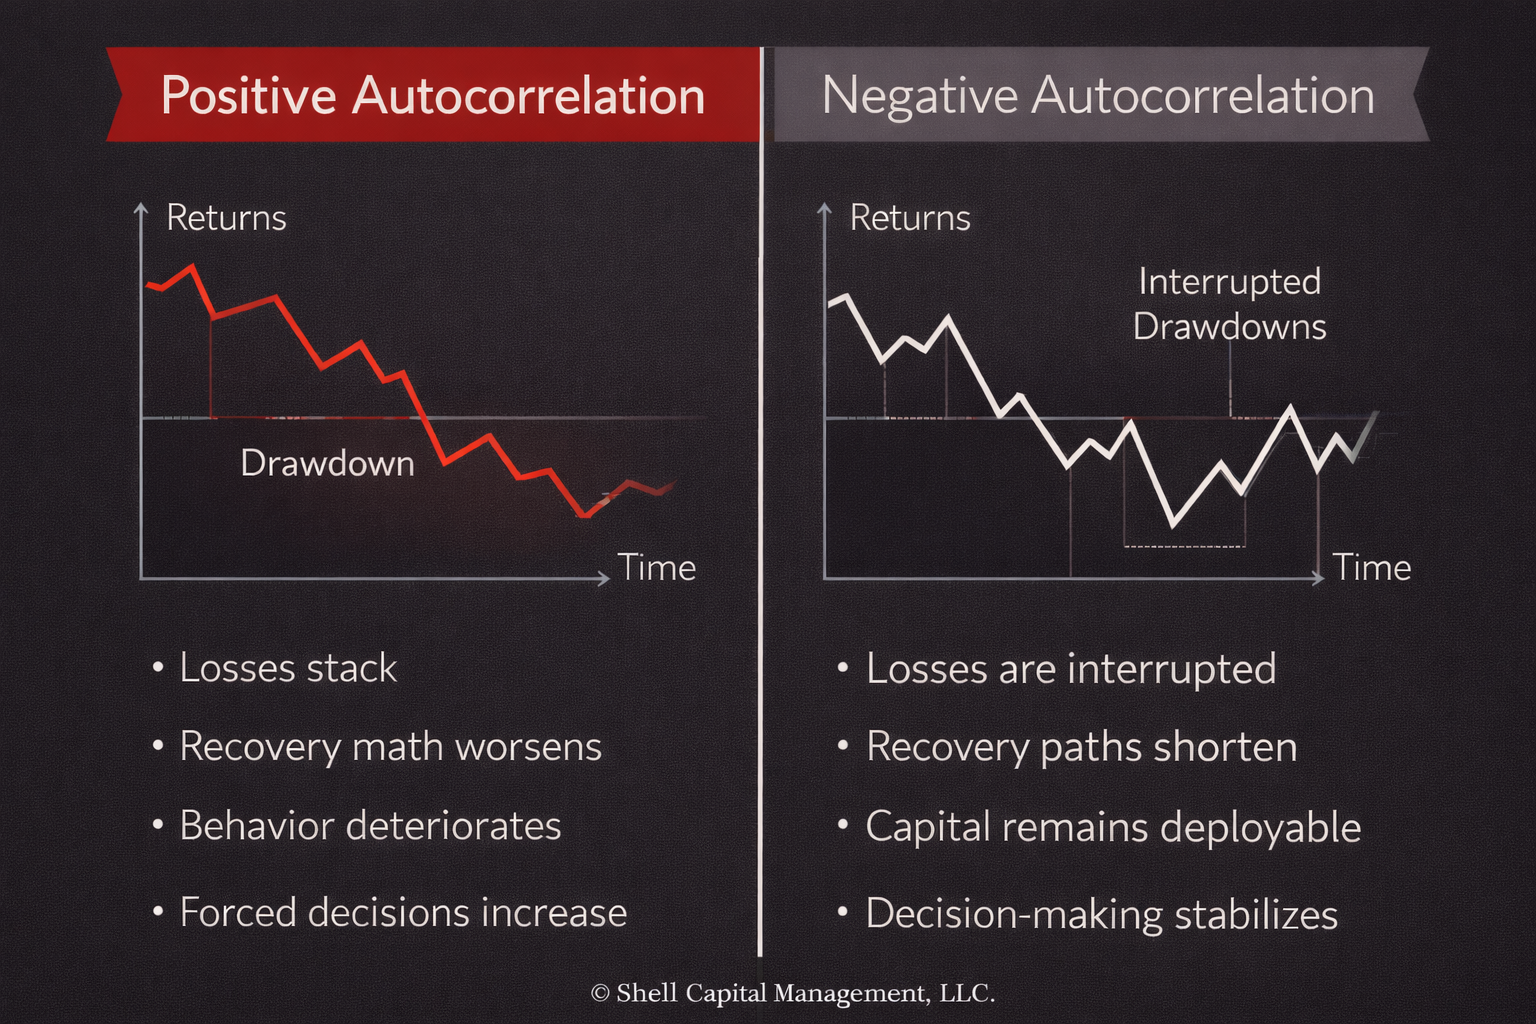
Two portfolios can share the same return and volatility yet experience radically different drawdowns. The difference is autocorrelation. Losses that cluster in time compound damage far faster than volatility alone suggests.
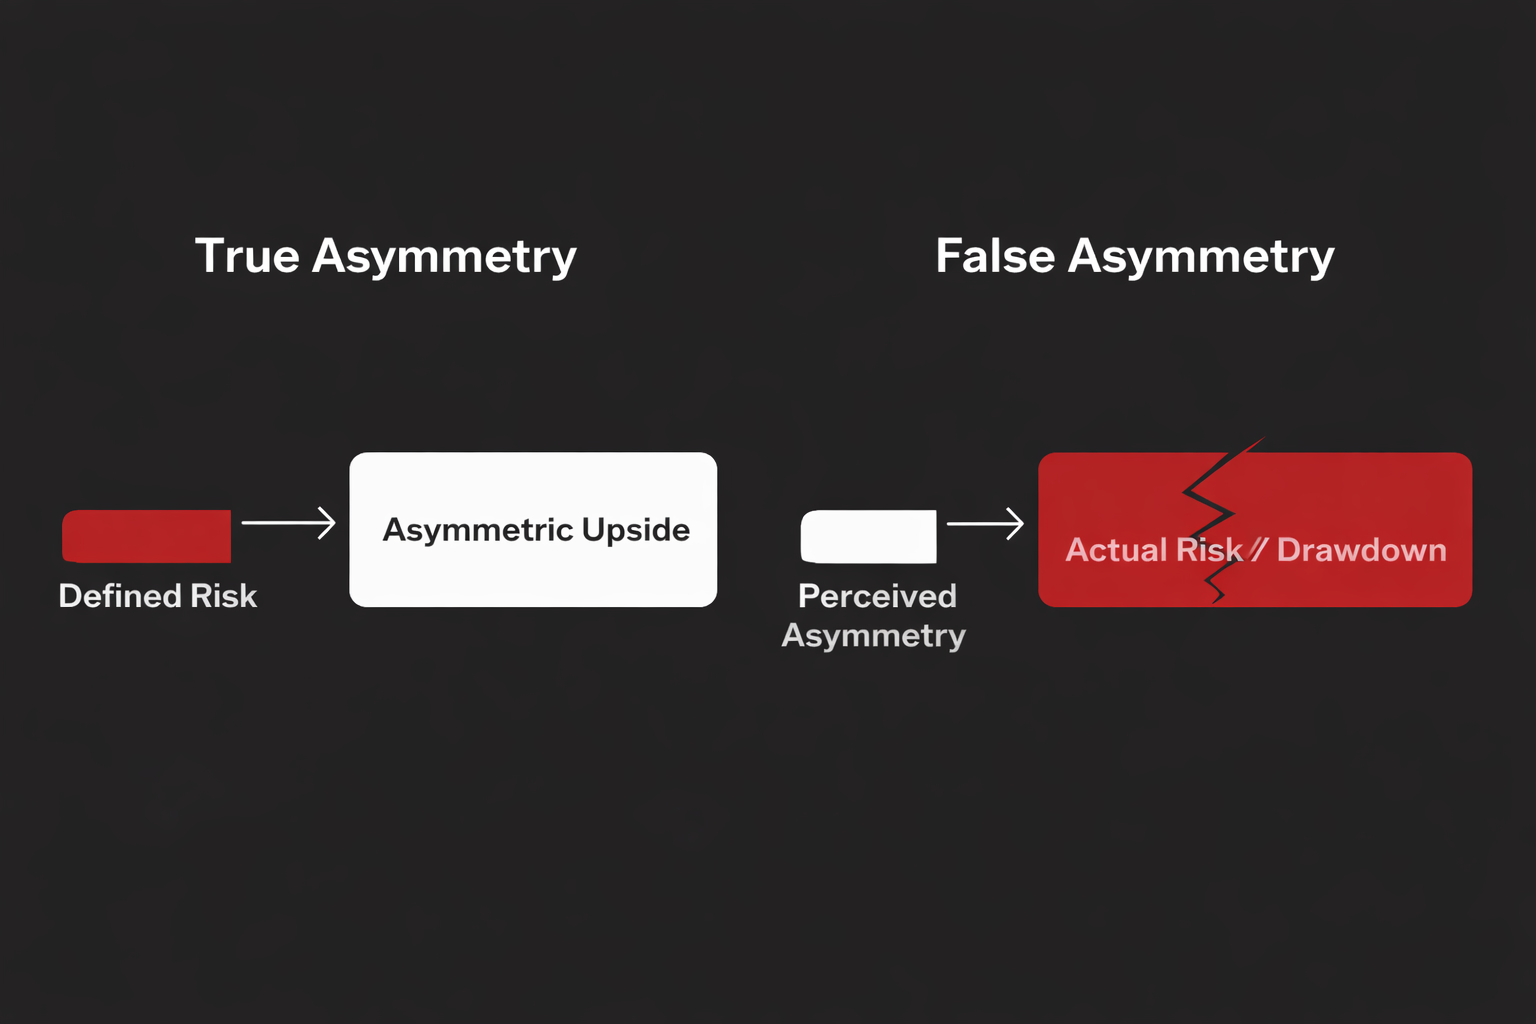
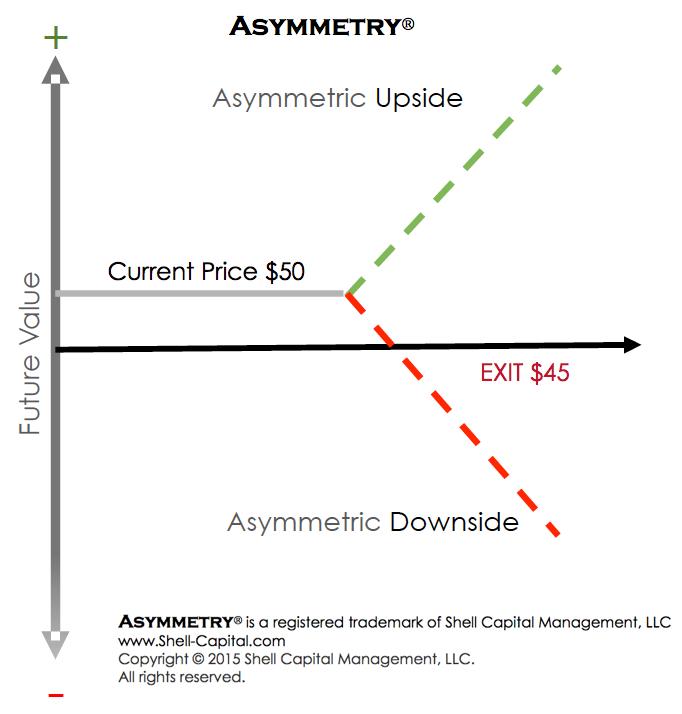
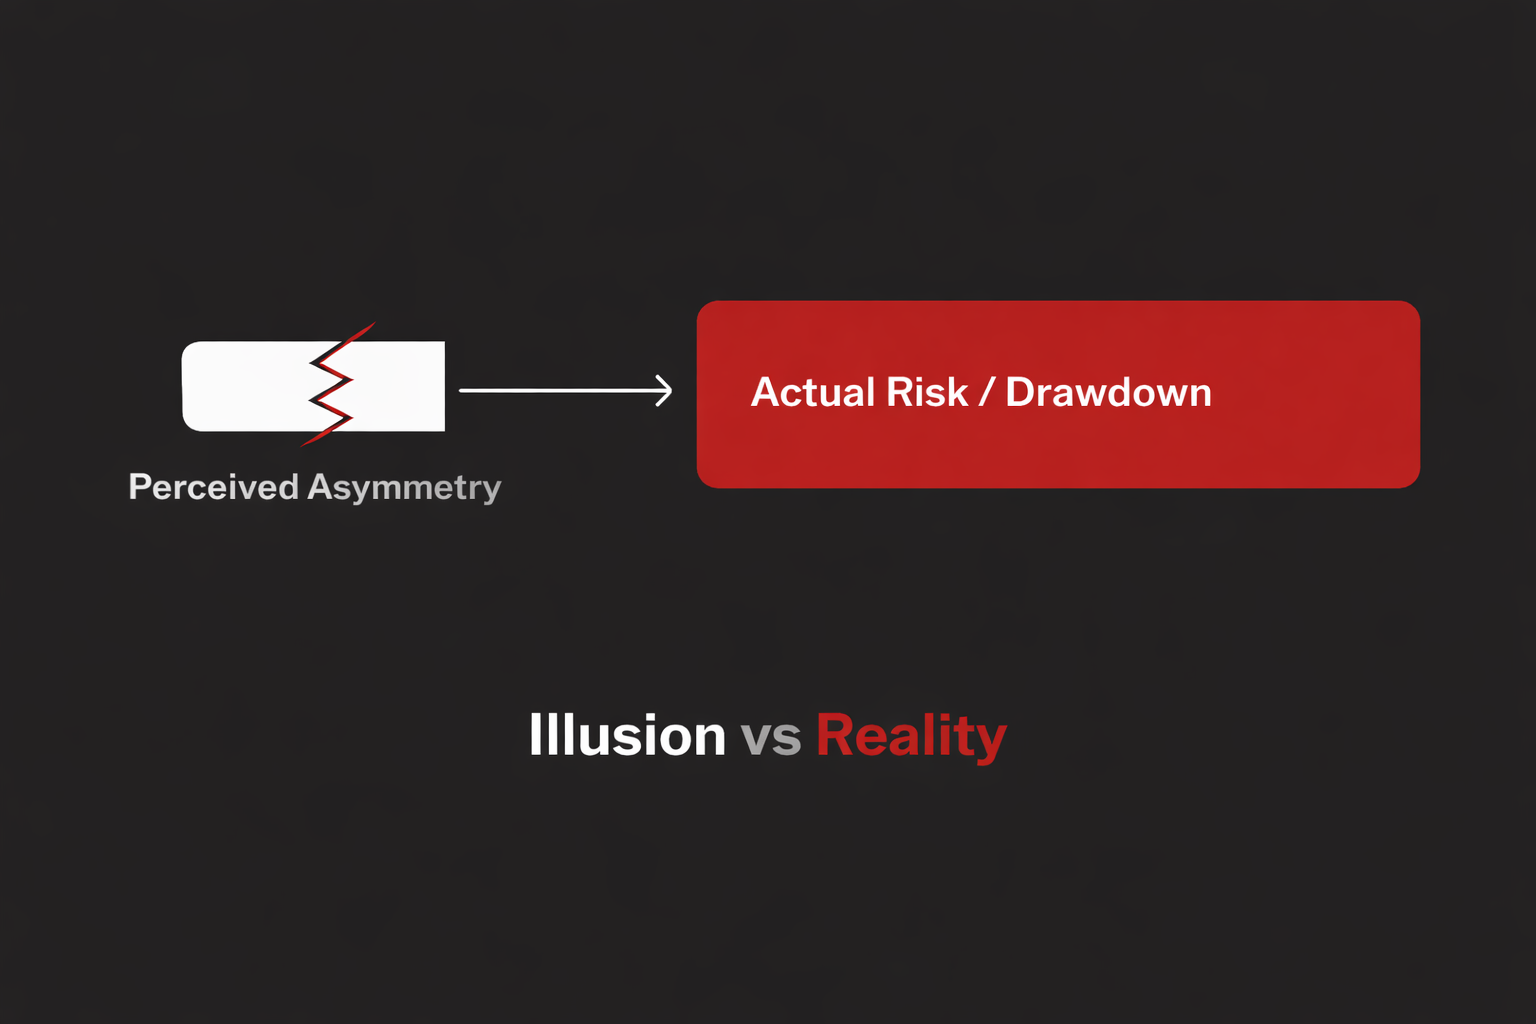
Many strategies look asymmetric—until volatility exposes what was hidden. True asymmetry starts with defined risk and leaves upside open. The difference is geometry, not storytelling.
A strategy can look disciplined, consistent, and “low risk” right up until the moment it isn’t. The Captain Condor $50 million collapse wasn’t caused by a market crash or bad luck — it was caused by a hidden asymmetry in the risk itself. This observation explains how smooth returns, high win rates, and “defined risk” trades can still produce catastrophic outcomes when portfolio risk is left undefined — and why true asymmetry always starts with survival, not consistency.

Most investment strategies look attractive until you price the cost of not blowing up. Nassim Nicholas Taleb explains why “alpha” built on averages often disappears once real-world survival, drawdowns, and irreversible loss are properly accounted for—an insight that matters deeply for business owners selling their company and transitioning from wealth creation to wealth preservation.
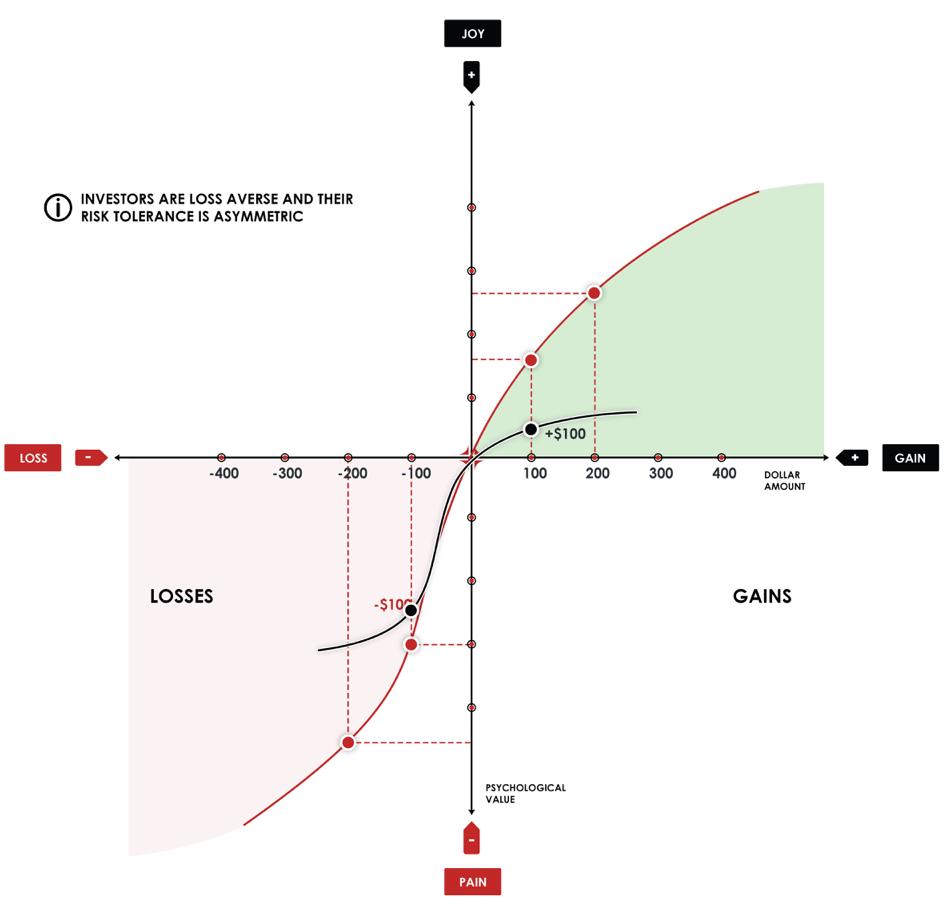
Most portfolios are built on averages and optimization. But markets don’t move on averages—and investors don’t live through drawdowns like a spreadsheet assumes. Under pressure, loss aversion changes decisions in predictable ways: winners get cut too early, losers get held too long, and volatility clusters. The real risk isn’t just market risk. It’s behavioral risk. That’s why we design systematic risk management that defines downside in advance and lets upside trends compound.
Good outcomes come from good decisions made consistently. ASYMMETRY® Artificial Intelligence strengthens decision systems by improving timing, discipline, and situational awareness without replacing human accountability.
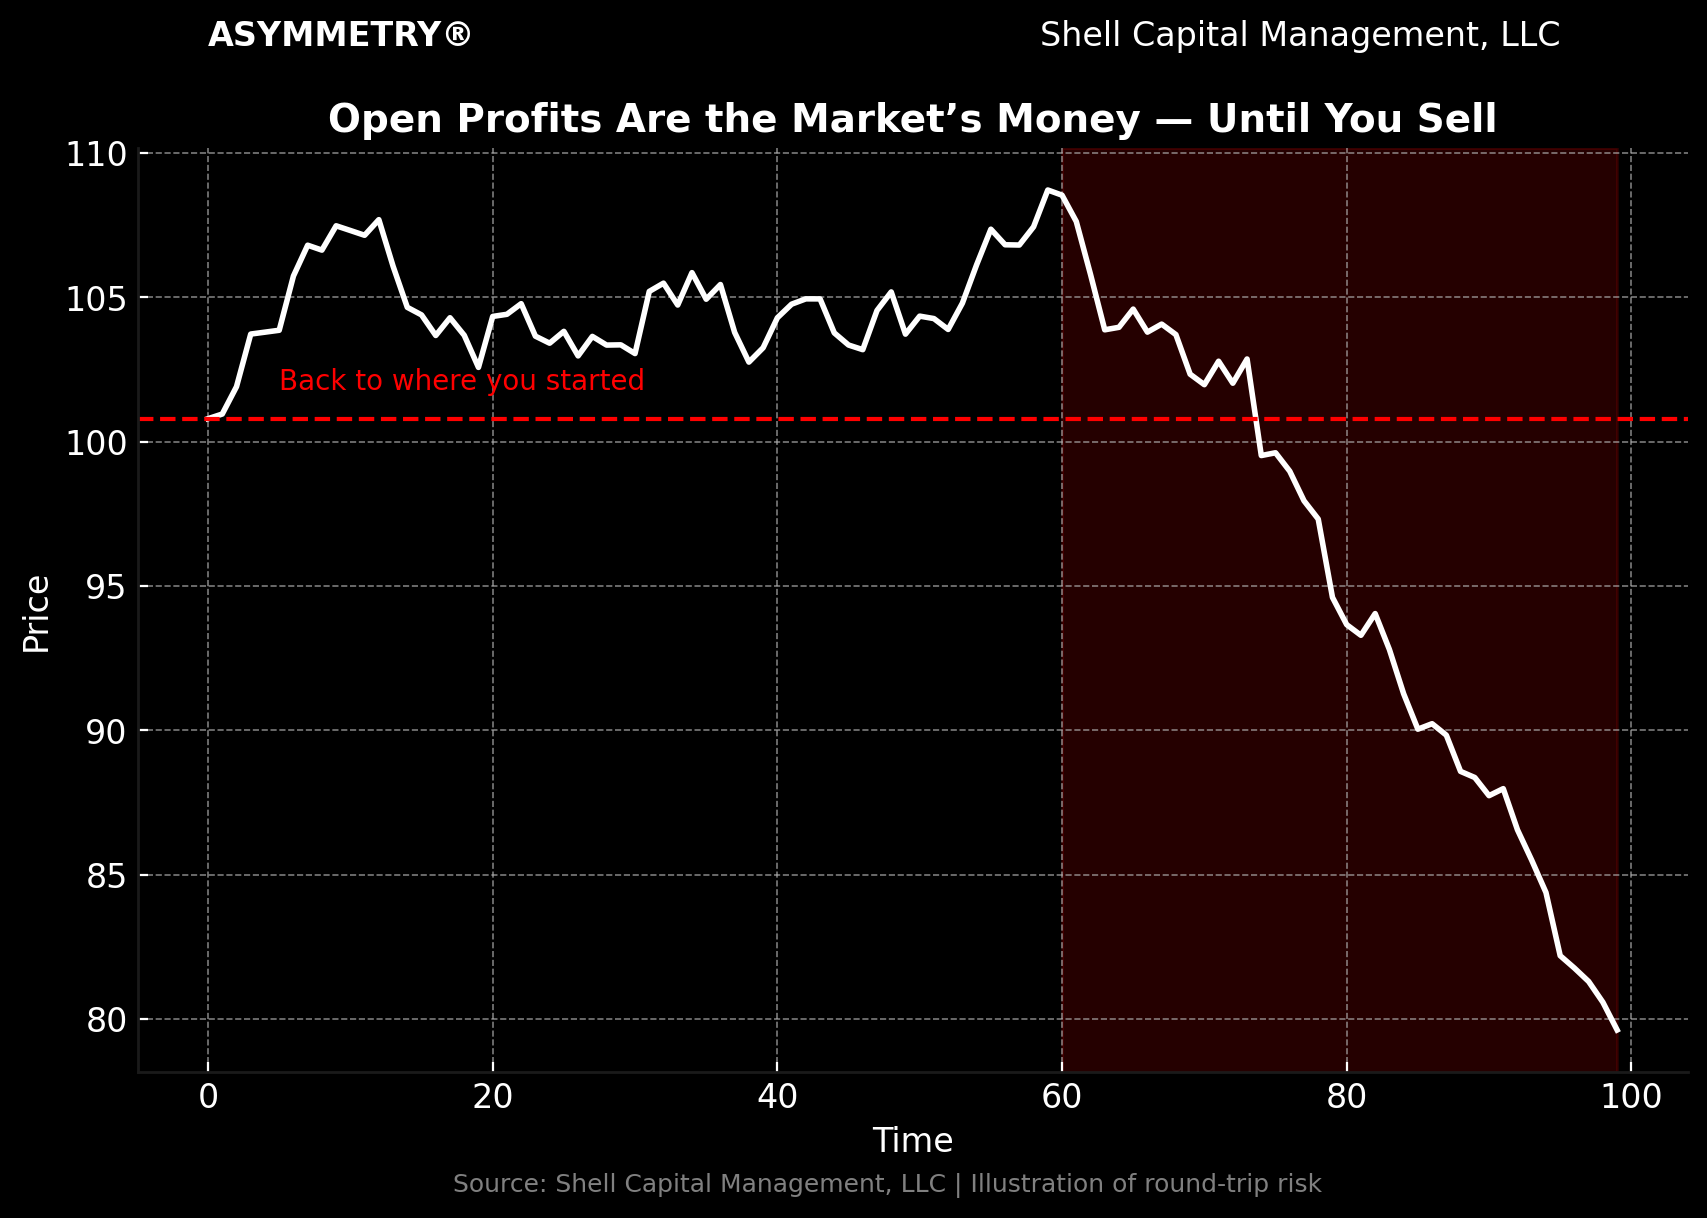
“The exit, not the entry, always determines the outcome. The exit determines if you win or lose, and how much you win or lose.” — Mike Shell
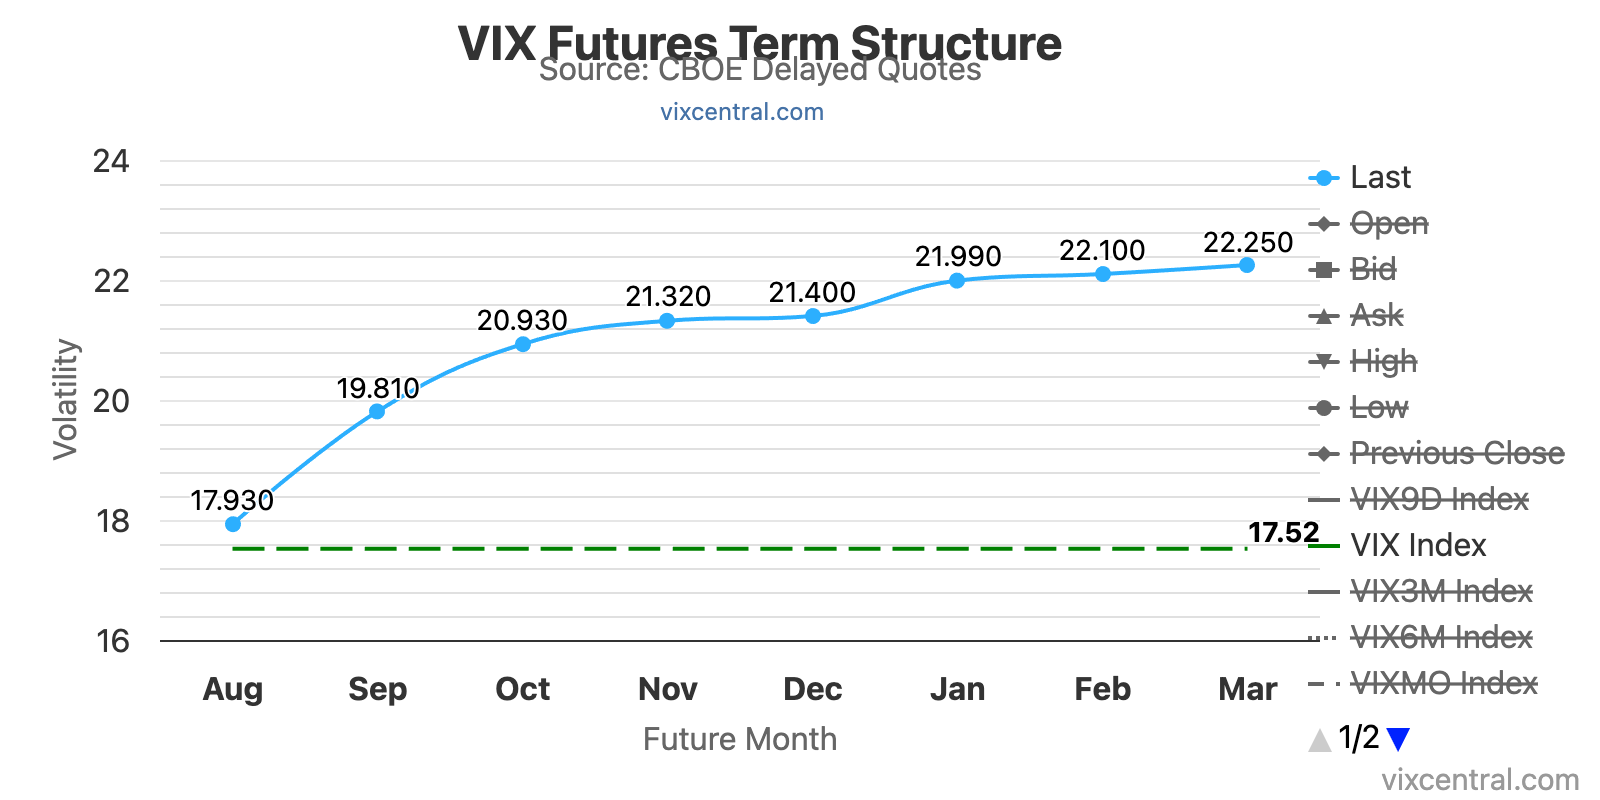
The steep contango in the VIX futures curve signals market complacency—but also reveals an asymmetric opportunity. This post explores how volatility suppression breeds fragility, why tail risk is mispriced during calm regimes, and how long-volatility positions can deliver convex payoffs when the curve snaps.
Why Is the Stock Market Down Today? The stock market is trading lower today as a mix of weak economic data, aggressive new tariffs, and stretched valuations shake investor confidence.
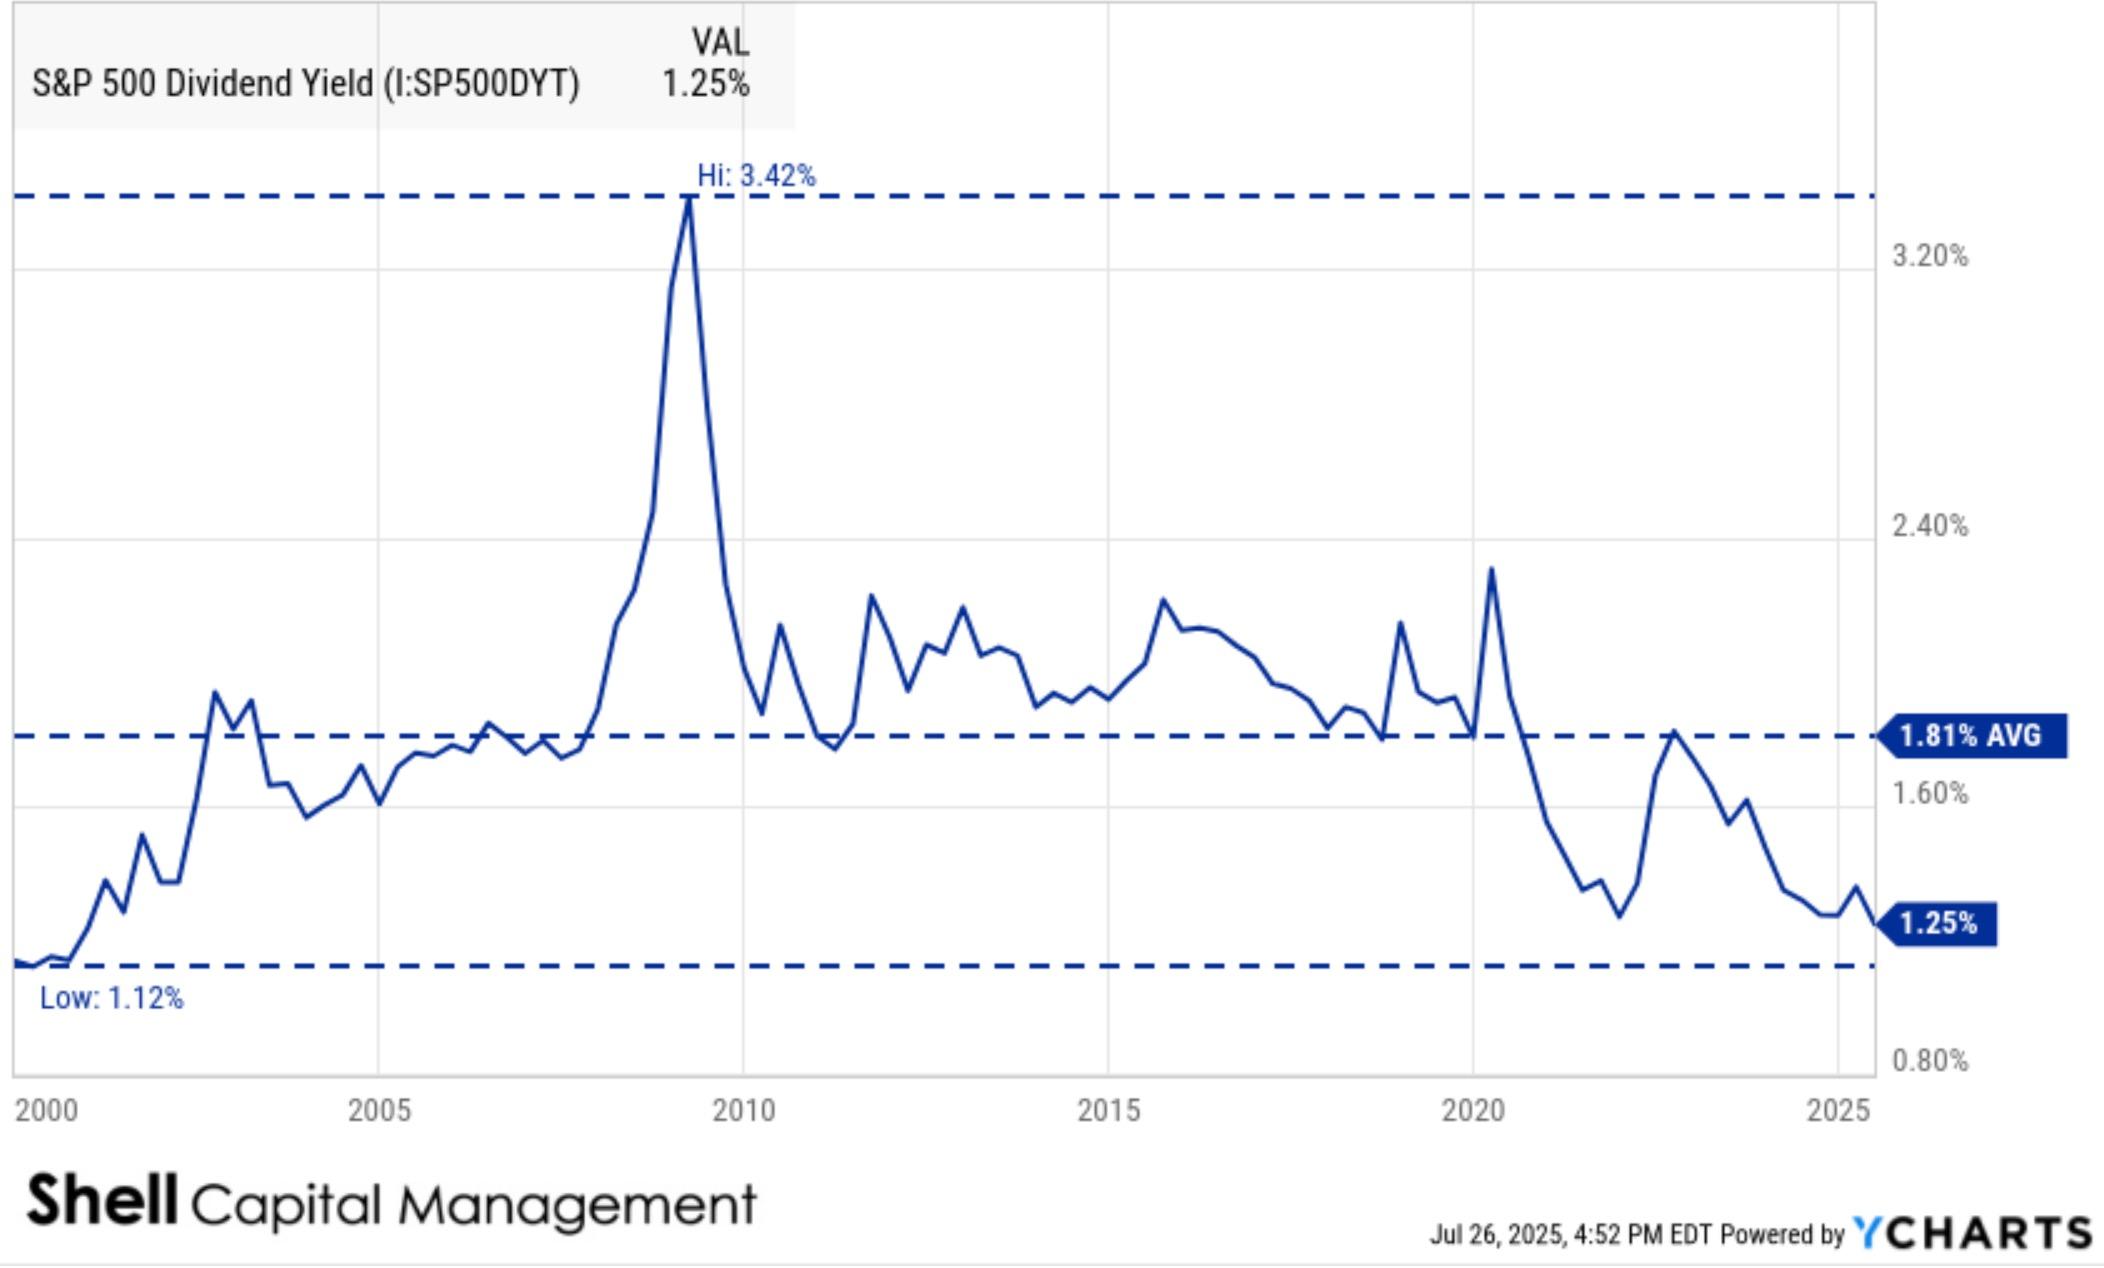
S&P 500 dividend yield has fallen to 1.25%, near a 20-year low. Discover what this means for equity risk, valuation, and how Shell Capital structures portfolios for asymmetric returns in today’s high-risk, low-reward environment.

Asymmetric returns aren’t found in undervalued stocks—they’re engineered through structured trades with defined risk and convex upside. Learn how.
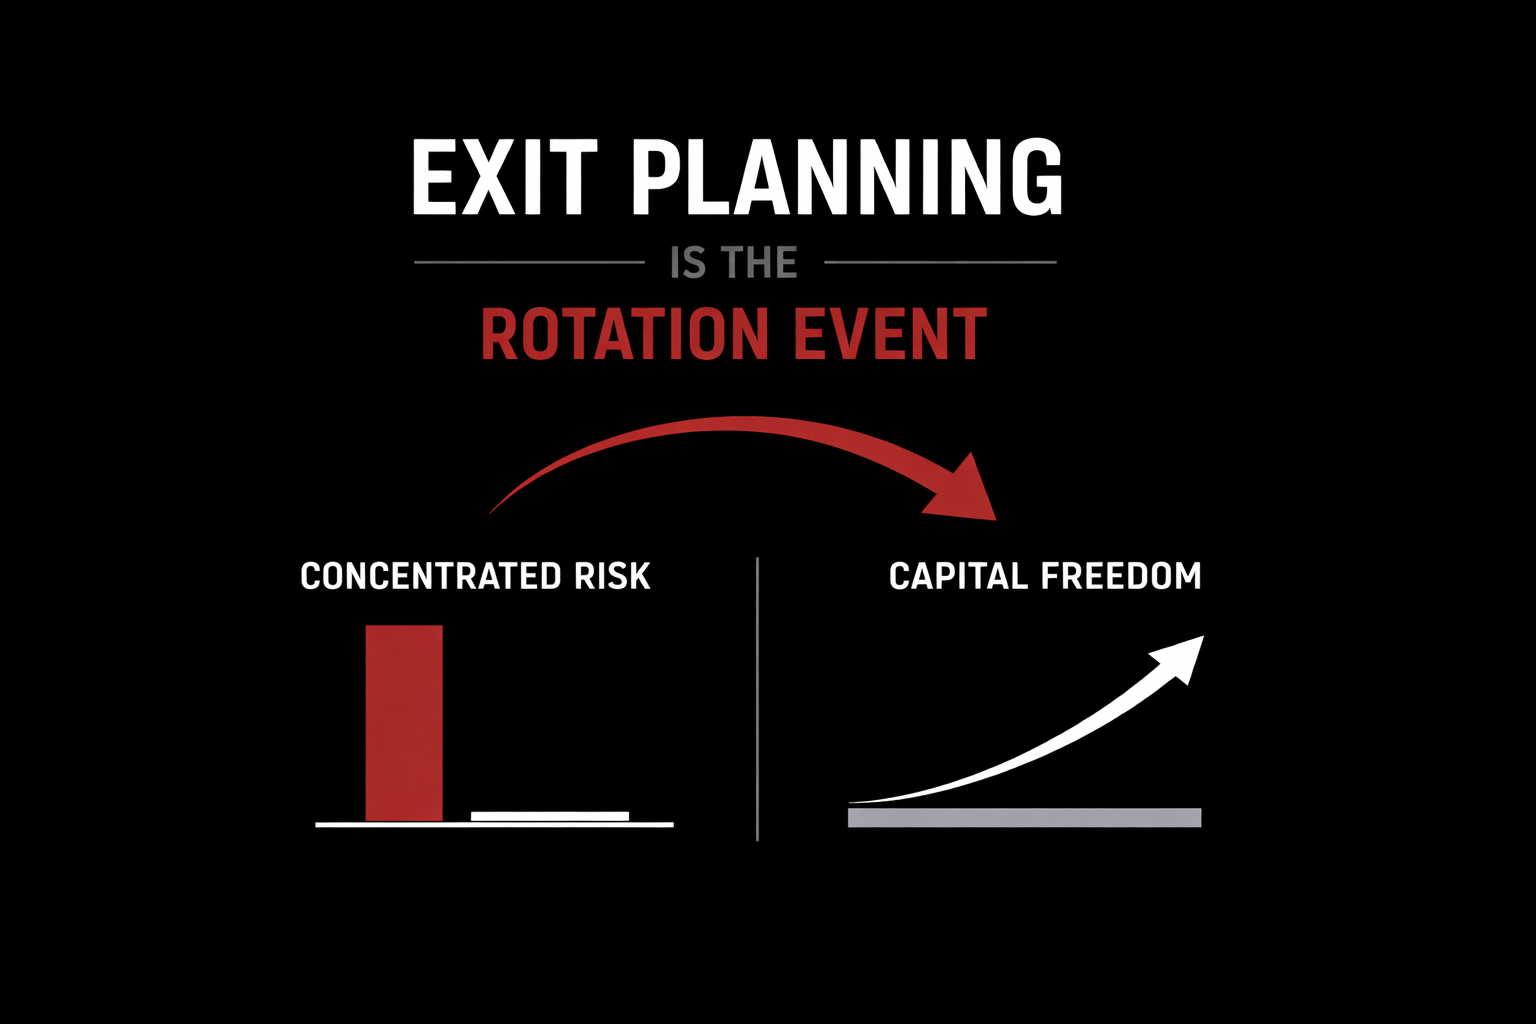
Exit planning isn’t about retirement — it’s the rotation event that moves business owners from effort-based income to capital-driven freedom. This ASYMMETRY® Observation explains why selling a business is only the beginning, and how engineered risk management keeps owners off the treadmill for good.

Discover how AVWAP analysis reveals selling pressure in the U.S. Dollar Index. Learn why price below anchored volume-weighted averages signals asymmetric risk, underwater positioning, and potential downside continuation—without forecasting.

We pursue what we refer to as "drawdown control" through individual position risk management, portfolio heat limits, and portfolio hedging for risk mitigation.

Investment Drawdowns from Market Losses Work Geometrically Against You Losses don’t scale linearly—they scale exponentially in how they hurt compounding.
Artificial intelligence is not an investment strategy. It is infrastructure. ASYMMETRY® Artificial Intelligence supports portfolio construction by enforcing risk architecture, exposure control, and system integrity.

BREADTH THRUST: As of April 24, 2025, all three major Bullish Percent Indexes have confirmed significant upward reversals in participation, with the Nasdaq Bullish Percent exploding higher in a breadth thrust.

The VIX futures curve continues to send a clear message: volatility remains elevated, and the market still expects it to fade—but not just yet.