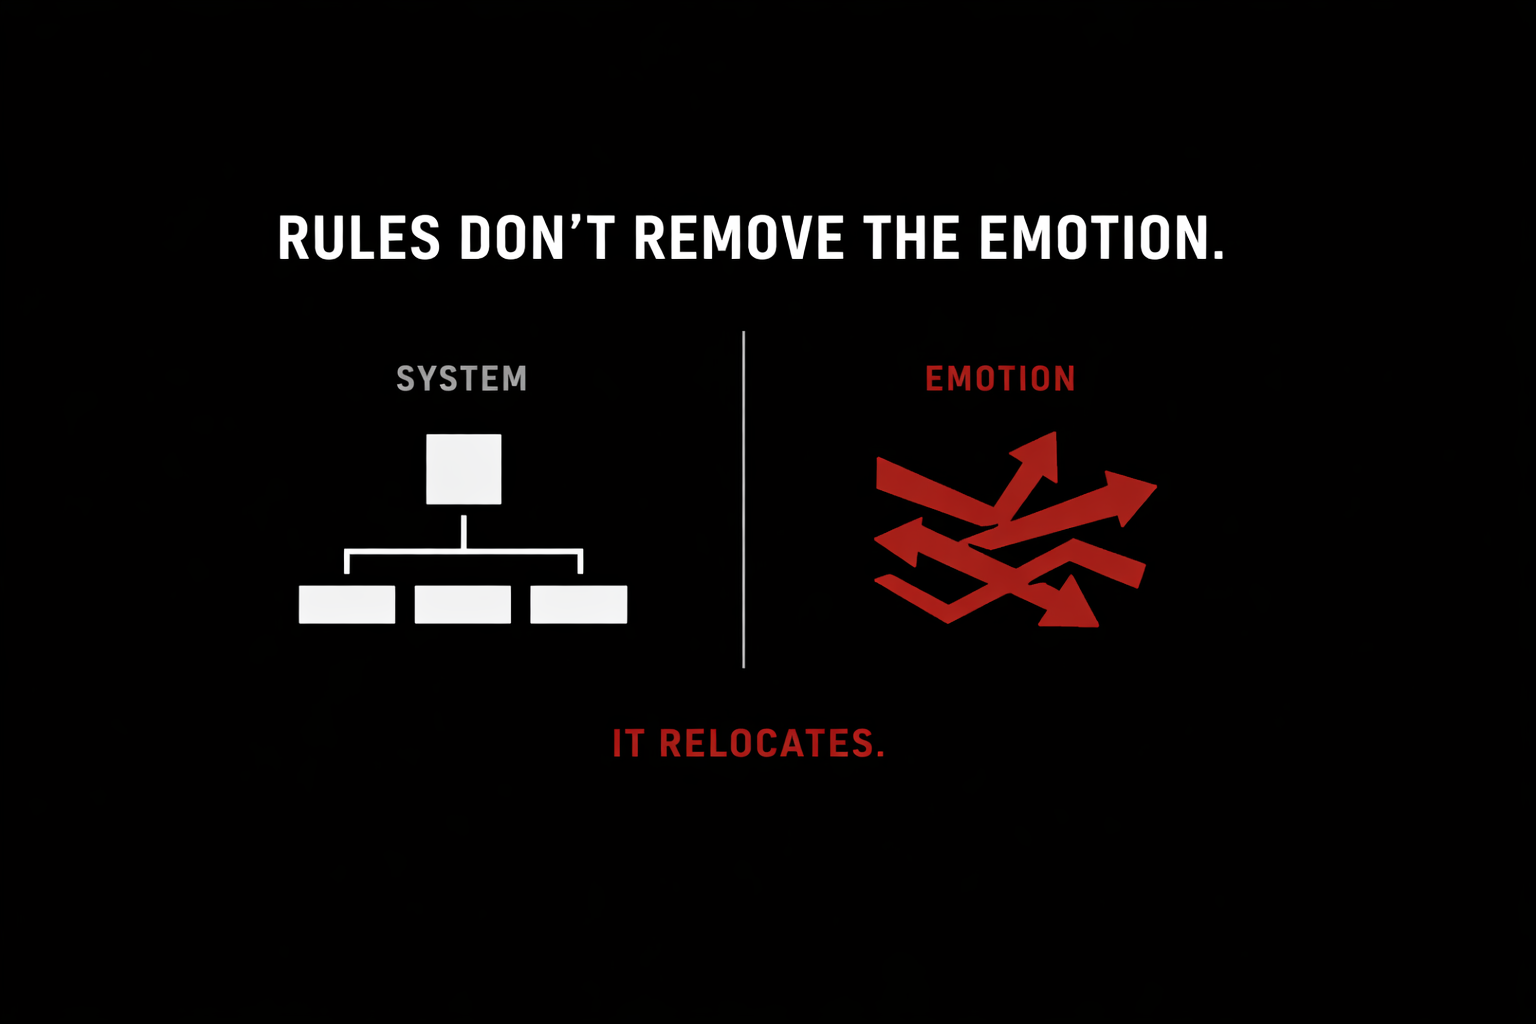
Quantitative Rules-Based Trading Systems Don't Remove the Emotion
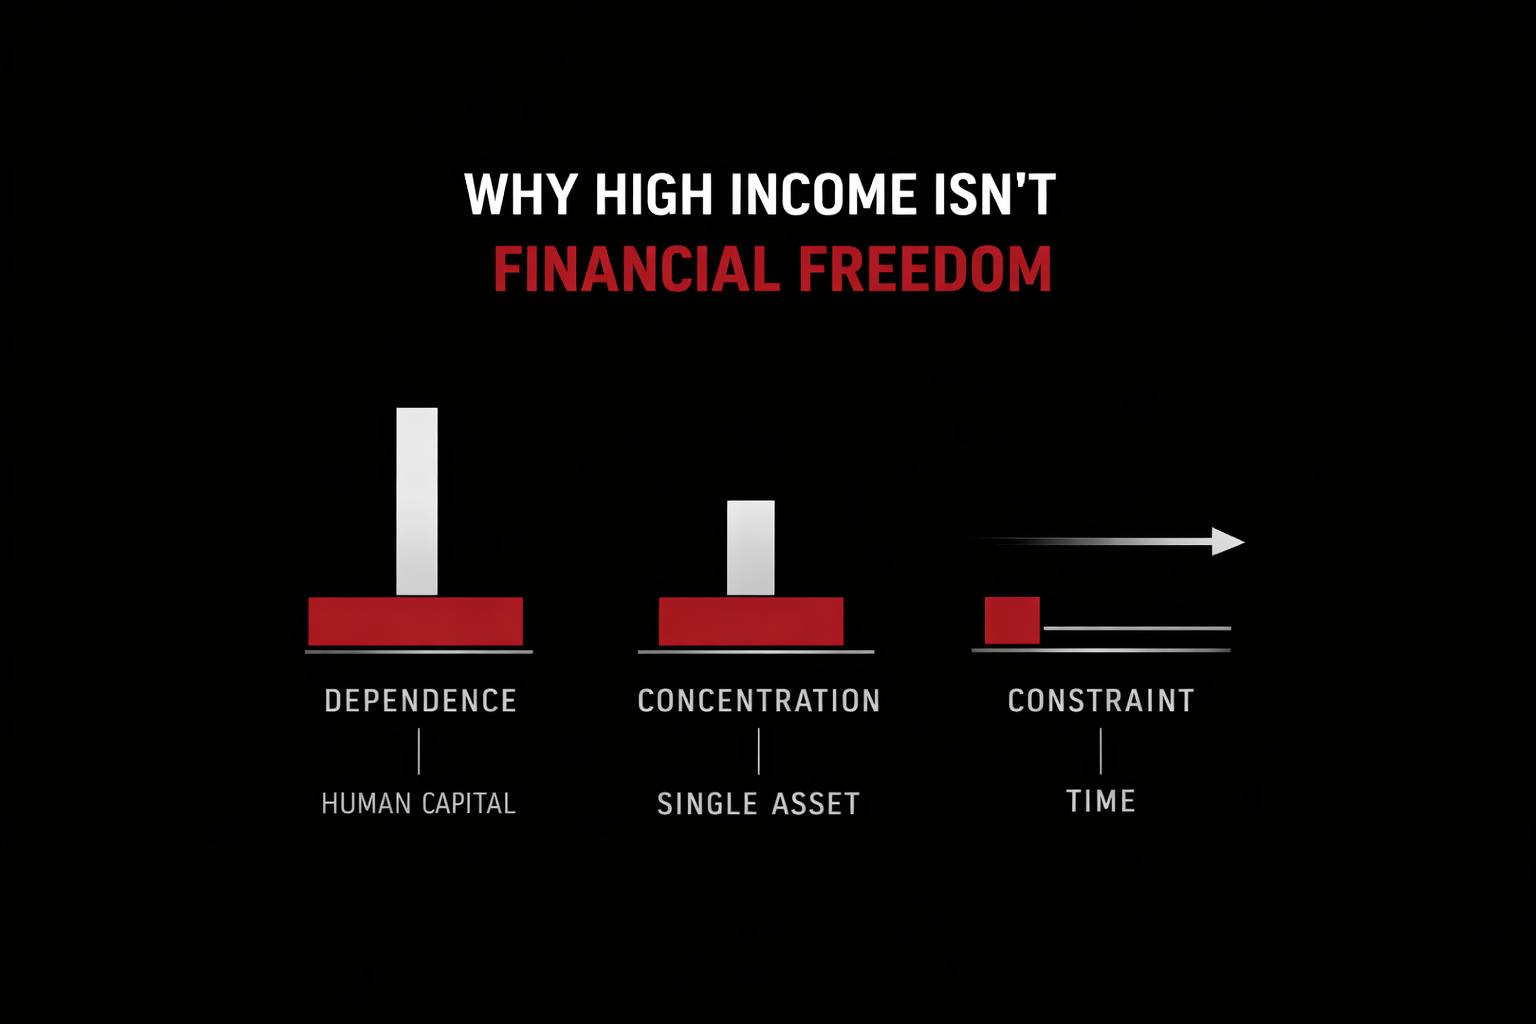
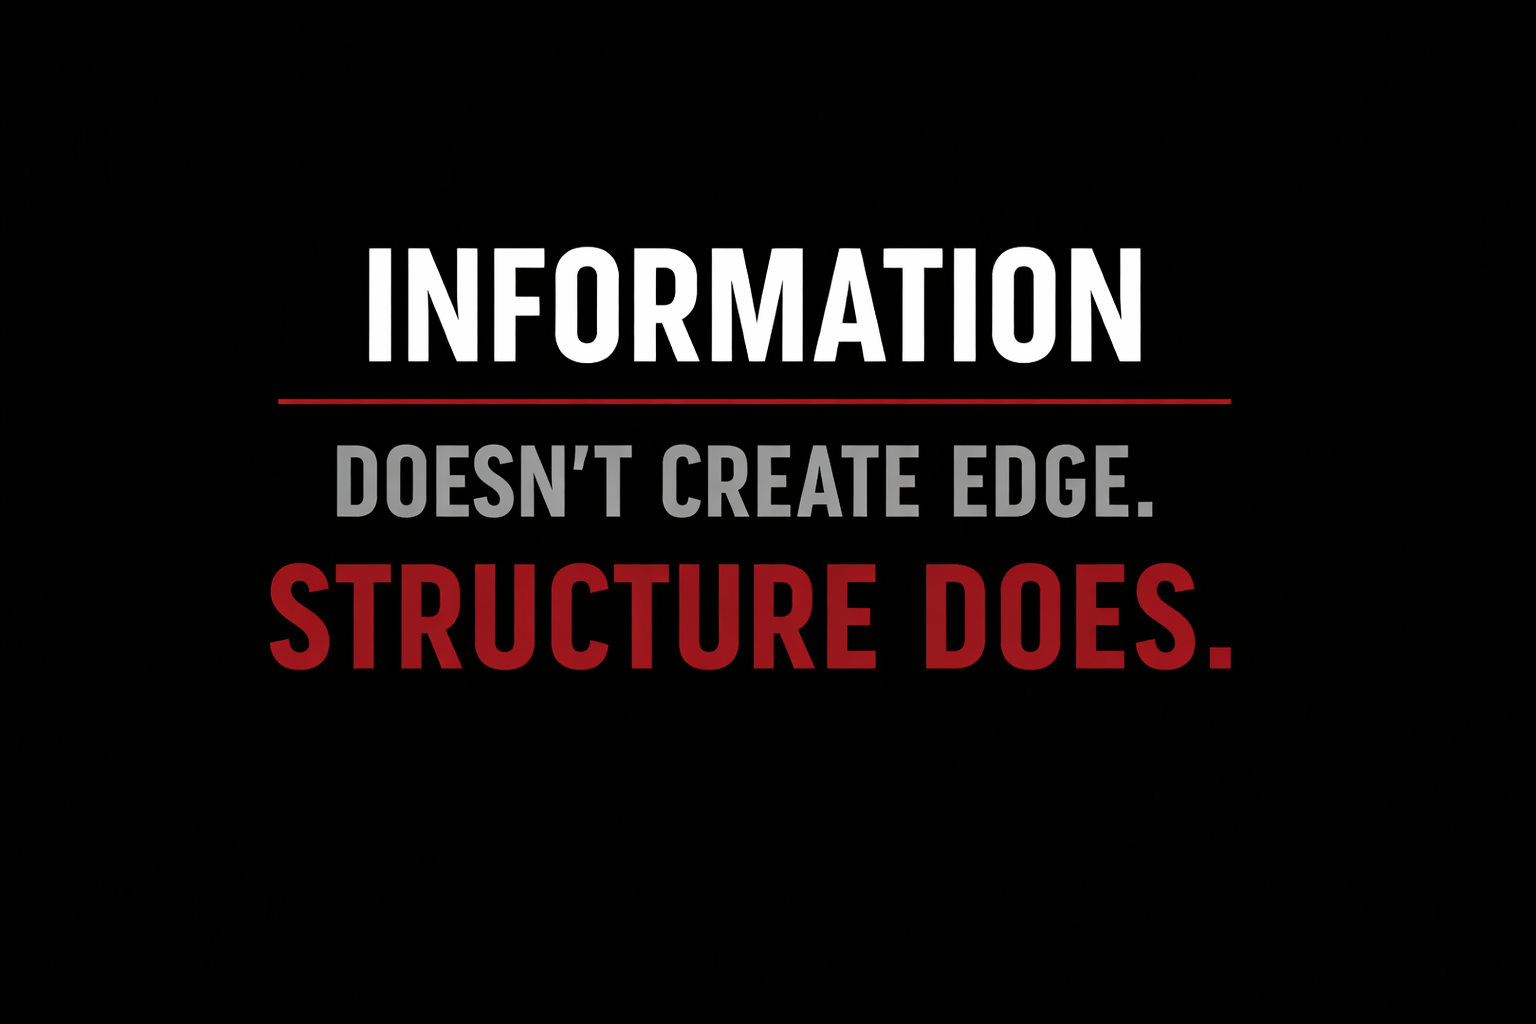
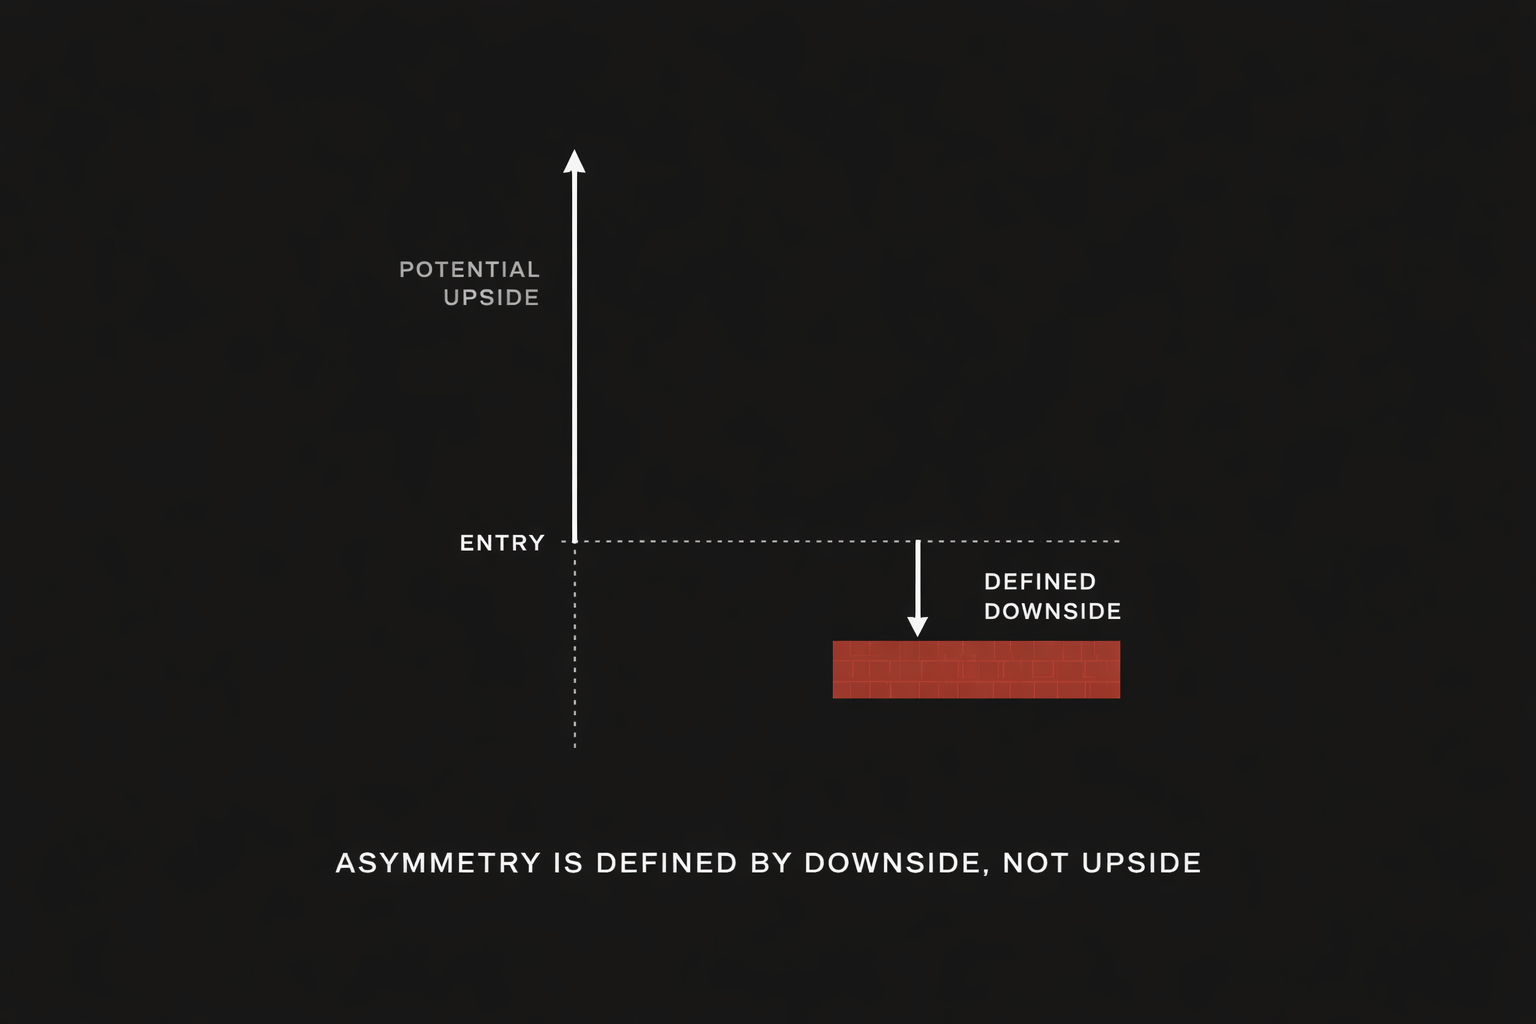
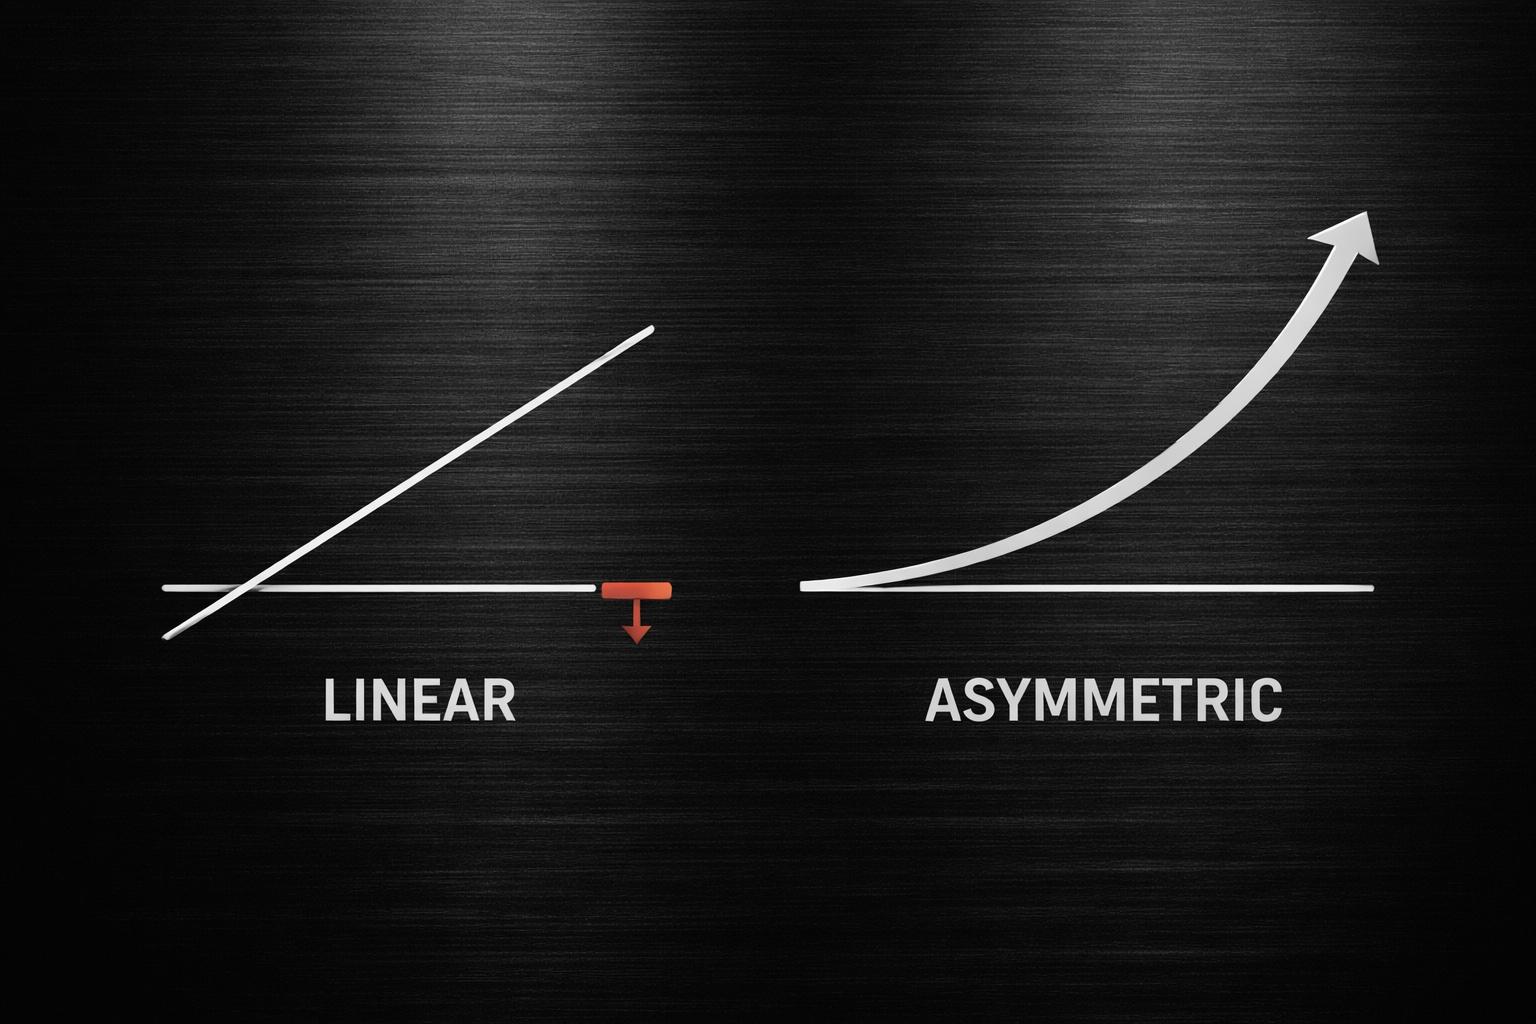
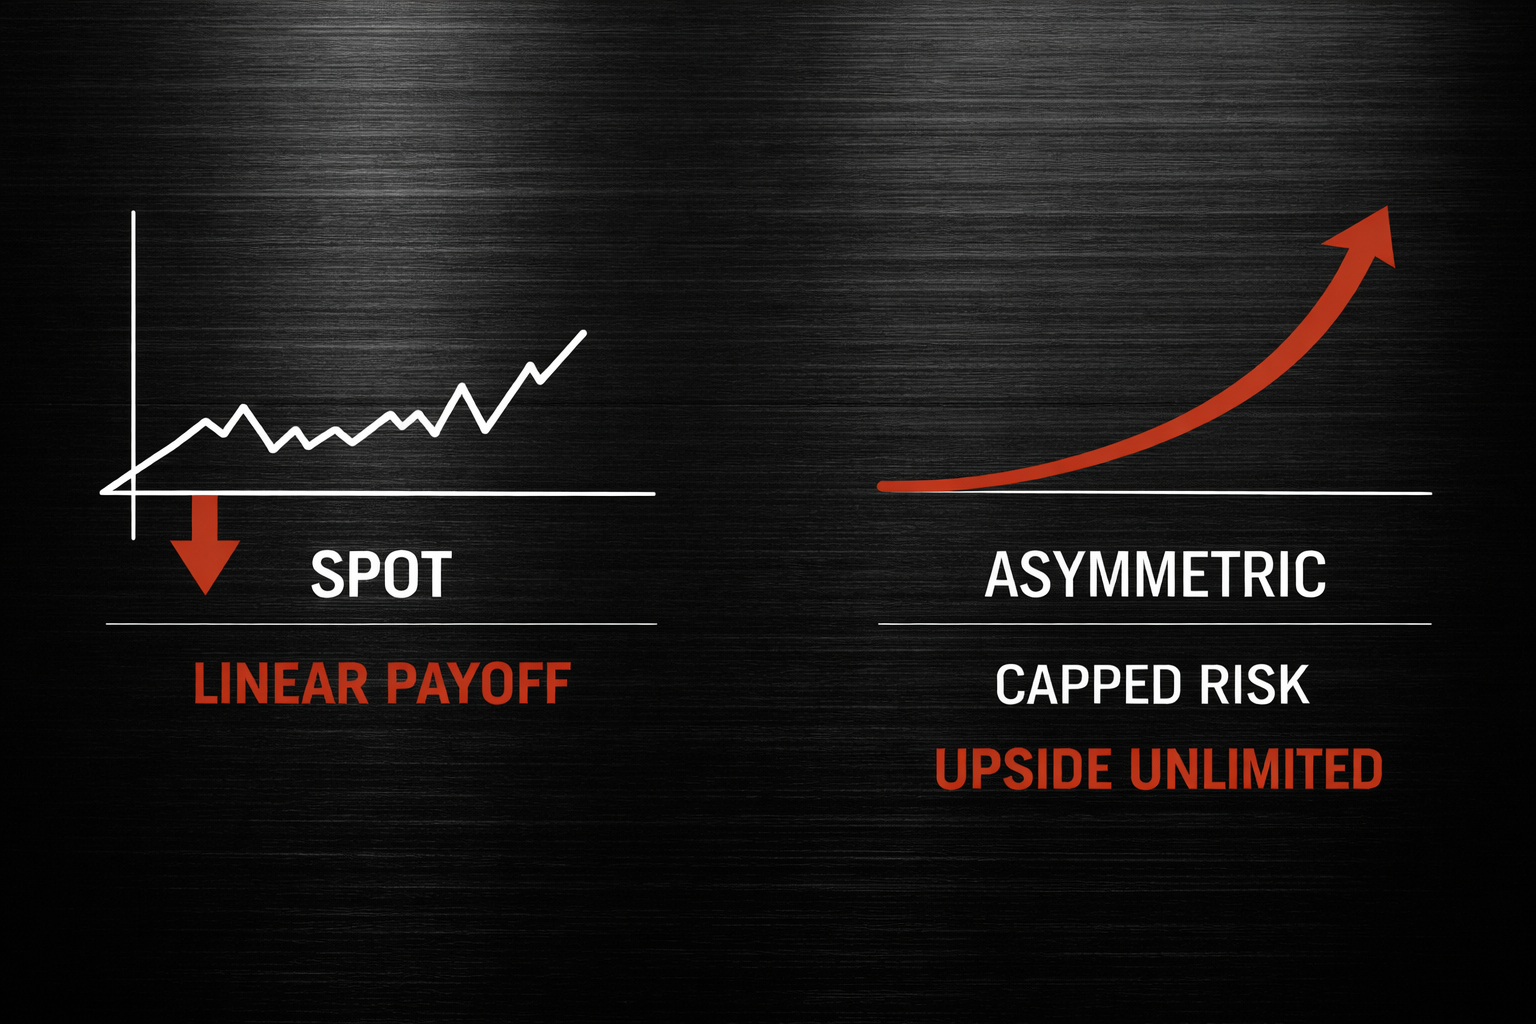
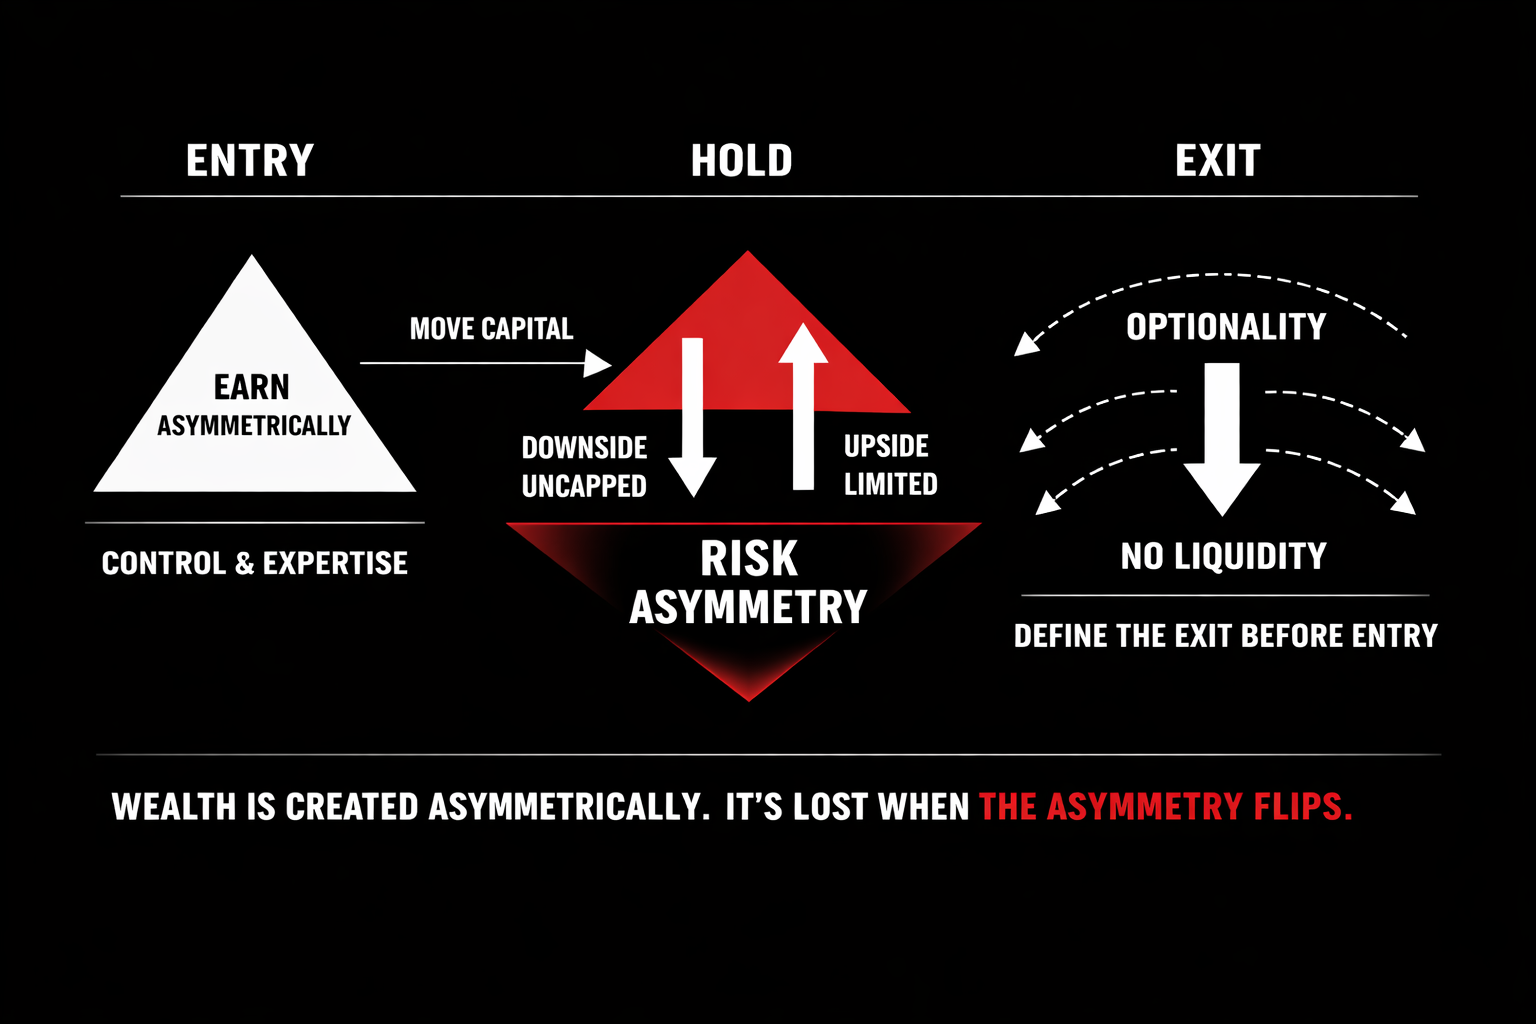
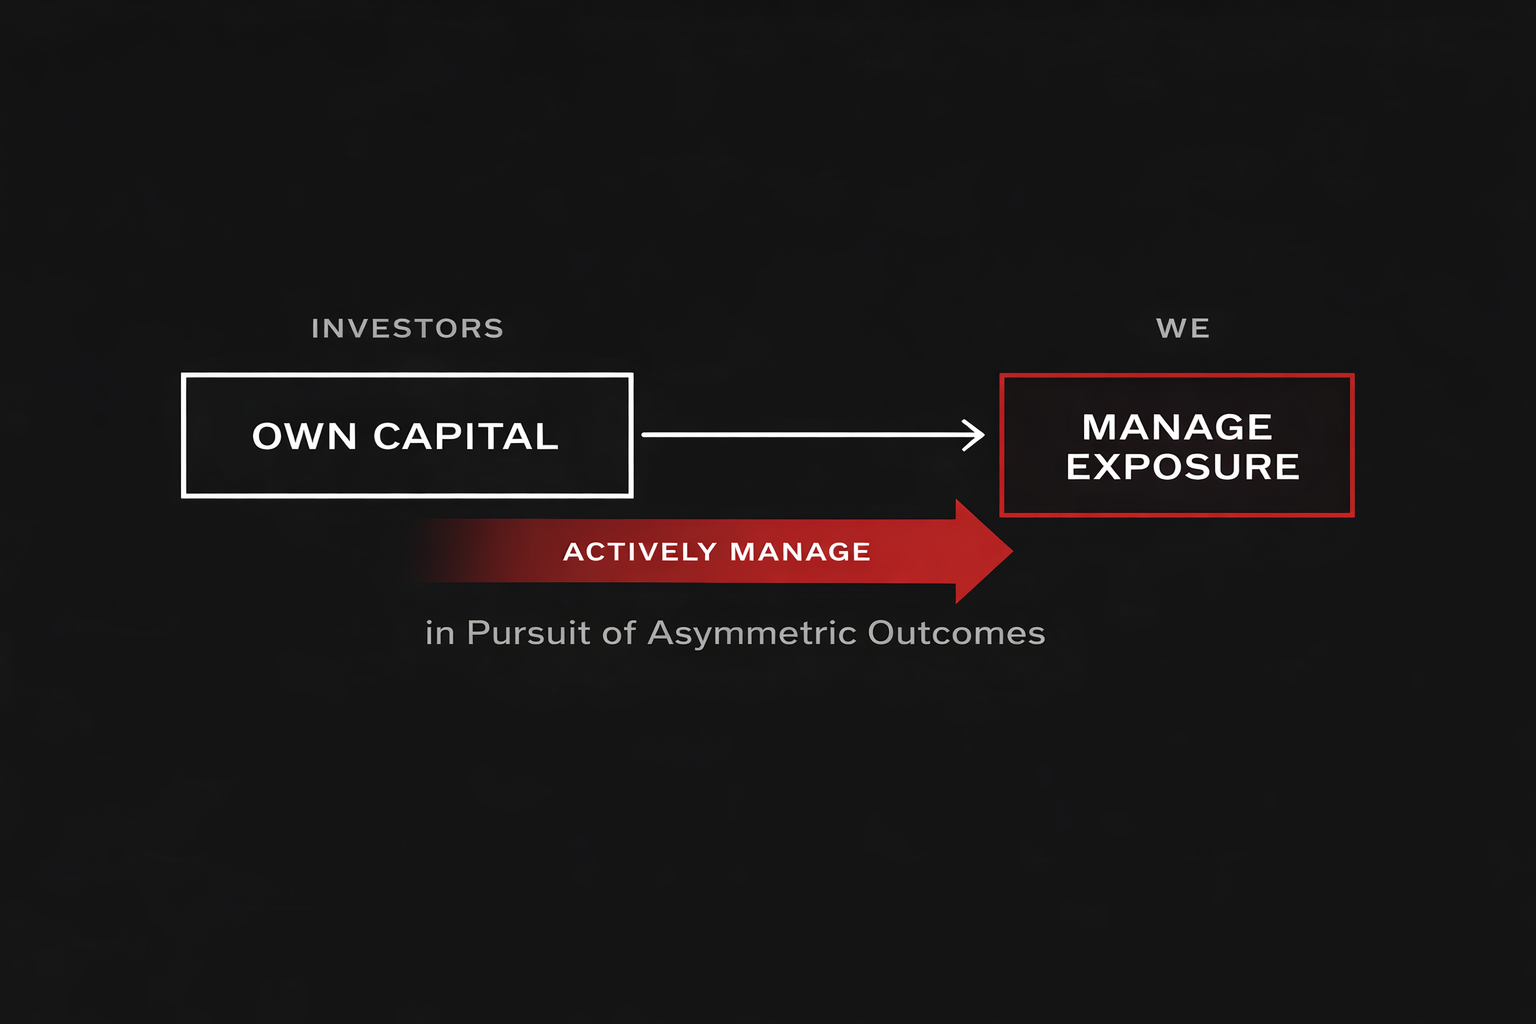
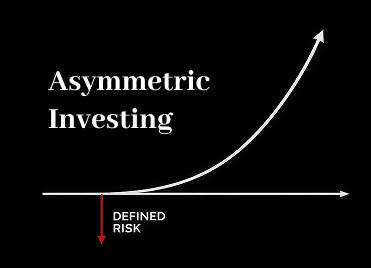
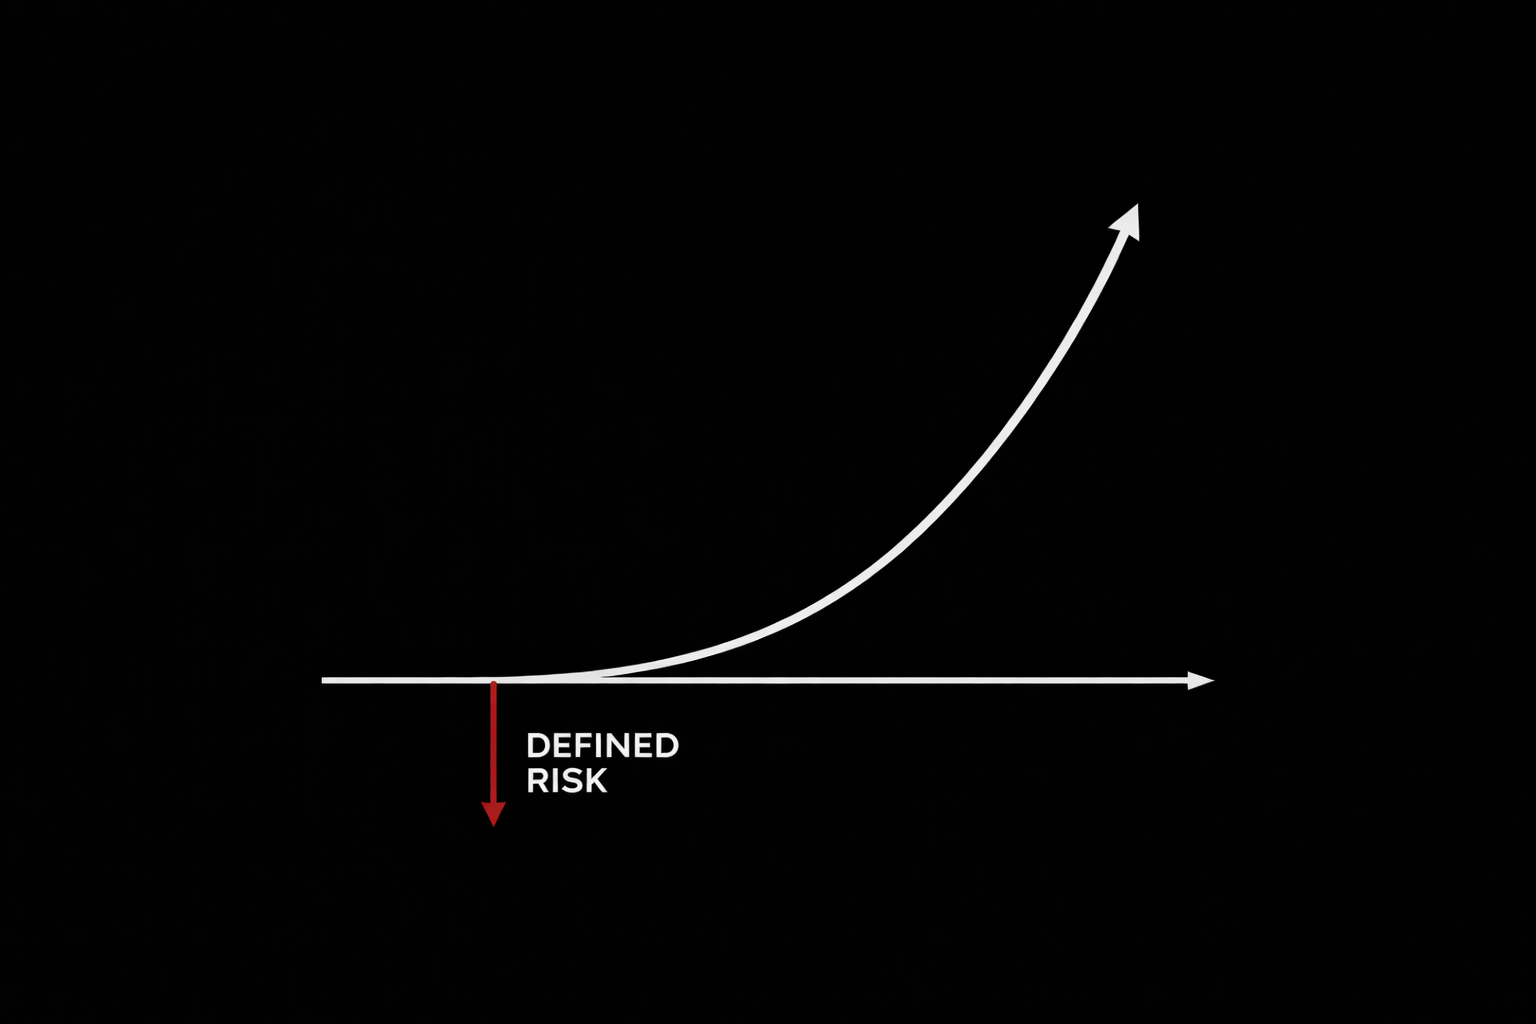
Why claims of “emotionless investing” misunderstand risk, behavior, and asymmetry—and why real edge comes from structure, not psychology. Investment systems don’t remove emotion. They expose it. The real edge isn’t feeling less—it’s designing a structure where emotion can’t quietly distort risk, sizing, or exits when it matters most.