
The Math Behind Asymmetric Investing
Most investors think asymmetry is a philosophy. It isn't.
It's math.
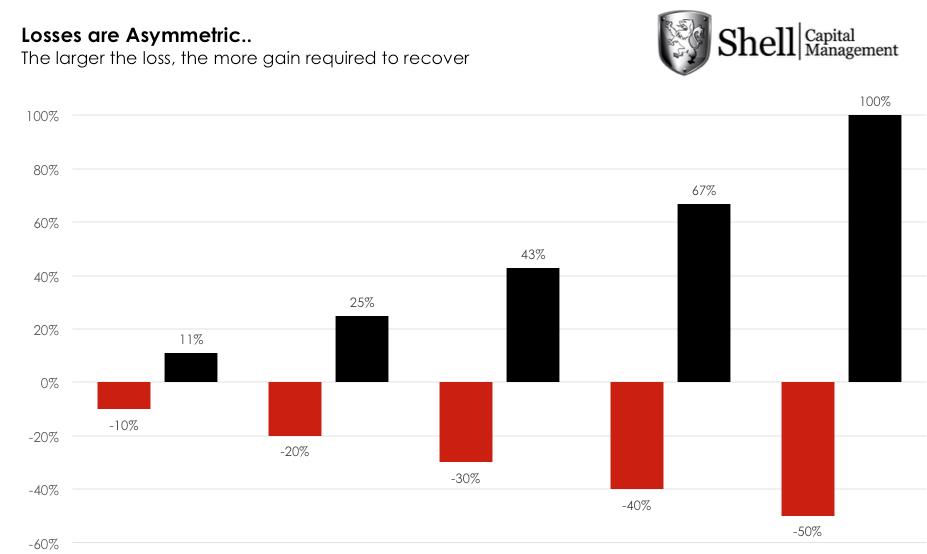
Here's the math most portfolios quietly ignore: A 50% loss requires a 100% gain just to break even. A 30% loss requires 43%. A 20% loss requires 25%.

Losses don't cancel gains symmetrically. They dominate them.
That single fact explains why avoiding large drawdowns matters more than chasing the highest average return. Returns compound multiplicatively, while losses compound destructively.
That's why volatility drag exists. Even if two strategies have the same average return, the one with larger drawdowns ends with less capital. Compounding amplifies downside far more than it rewards upside.
Asymmetry is simply the deliberate structuring of that math in your favor.
At its core, asymmetric investing is about shaping the payoff distribution, not predicting outcomes.
You don't need to be right often. You need to lose little when you're wrong and make more when you're right.
Mathematically, that's positive expectancy with bounded downside and unbounded—or at least larger—upside.
Expected value isn't just probability times payoff. It's probability times payoff across an entire distribution of outcomes, including tails.
Most investors fixate on the middle of the distribution and ignore the left tail. That's where portfolios break.
This isn't theoretical. In 2022, a 60/40 portfolio dropped 17%. In 2008, it fell 37%. Both times, investors who stayed fully exposed needed years to recover—not because markets stayed down, but because the math of recovery is brutally asymmetric.
Asymmetry is what happens when you define risk first.
When downside is predefined, position size becomes a math problem, not an opinion. If you know the maximum loss per position, you can scale exposure so no single outcome matters. Optionality replaces fragility.
This is why exits matter more than entries.
Most investors obsess over entry points. "Is this the right time to buy?" But entries only determine potential. Exits determine reality.
An exit rule defines your maximum loss. That maximum loss defines your position size. Position size determines whether one bad decision ends your year—or barely registers.
That chain is math, not storytelling.
Entries feel intelligent. Exits determine survival.
Asymmetric strategies don't need forecasts to be precise. They need rules that tilt the distribution. Trend-following does this by cutting losers and letting winners expand. Options do this by explicitly shaping convex payoff curves. Risk-managed portfolios do it by enforcing loss limits before compounding damage sets in.
Over time, small edges plus controlled downside create nonlinear outcomes. The curve bends upward not because returns are higher, but because losses are smaller.
That's the math behind asymmetry.
It's not about maximizing returns. It's about maximizing the probability of long-term survival while preserving upside.
Once you understand this math, traditional portfolios reveal themselves for what they are: strategies optimized for average outcomes in average times, with no plan for when the distribution breaks.
Asymmetric portfolios are built for the opposite: surviving the extremes while capturing the middle.
That's not philosophy. That's engineering.
Mike Shell is the Founder and Chief Investment Officer of Shell Capital Management, LLC, a registered investment adviser. He serves as portfolio manager of ASYMMETRY® Managed Portfolios, a separately managed account program with trade execution and custody provided by Goldman Sachs Custody Solutions.
The observations shared in ASYMMETRY® Observations are for general informational purposes only and do not constitute investment advice or a recommendation to buy or sell any security. The content is not intended to provide a complete description of Shell Capital’s investment process or strategies and should not be relied upon in making investment decisions. Securities, charts, indicators, formulas, or examples referenced are illustrative in nature and are not intended to represent actual client holdings or recommendations. Past performance is not indicative of future results. Investing involves risk, including the potential loss of principal. Any opinions expressed are subject to change without notice as market conditions evolve. All information is believed to be reliable but is not guaranteed and should be independently verified. Shell Capital Management, LLC provides investment advisory services only to clients pursuant to a written investment management agreement. This material is not intended as an offer or solicitation for advisory services in any jurisdiction where such offer or solicitation would be unlawful.