

Category: ASYMMETRY® Observations
-

Citi Panic Euphoria Model Remains Elevated
We actively monitor several investor sentiment gauges that indicate how optimistic or pessimistic investors are about the stock market. One of the sentiment indicators we monitor is the Citigroup Panic/Euphoria Model. When it reaches an extreme,… Read More
-
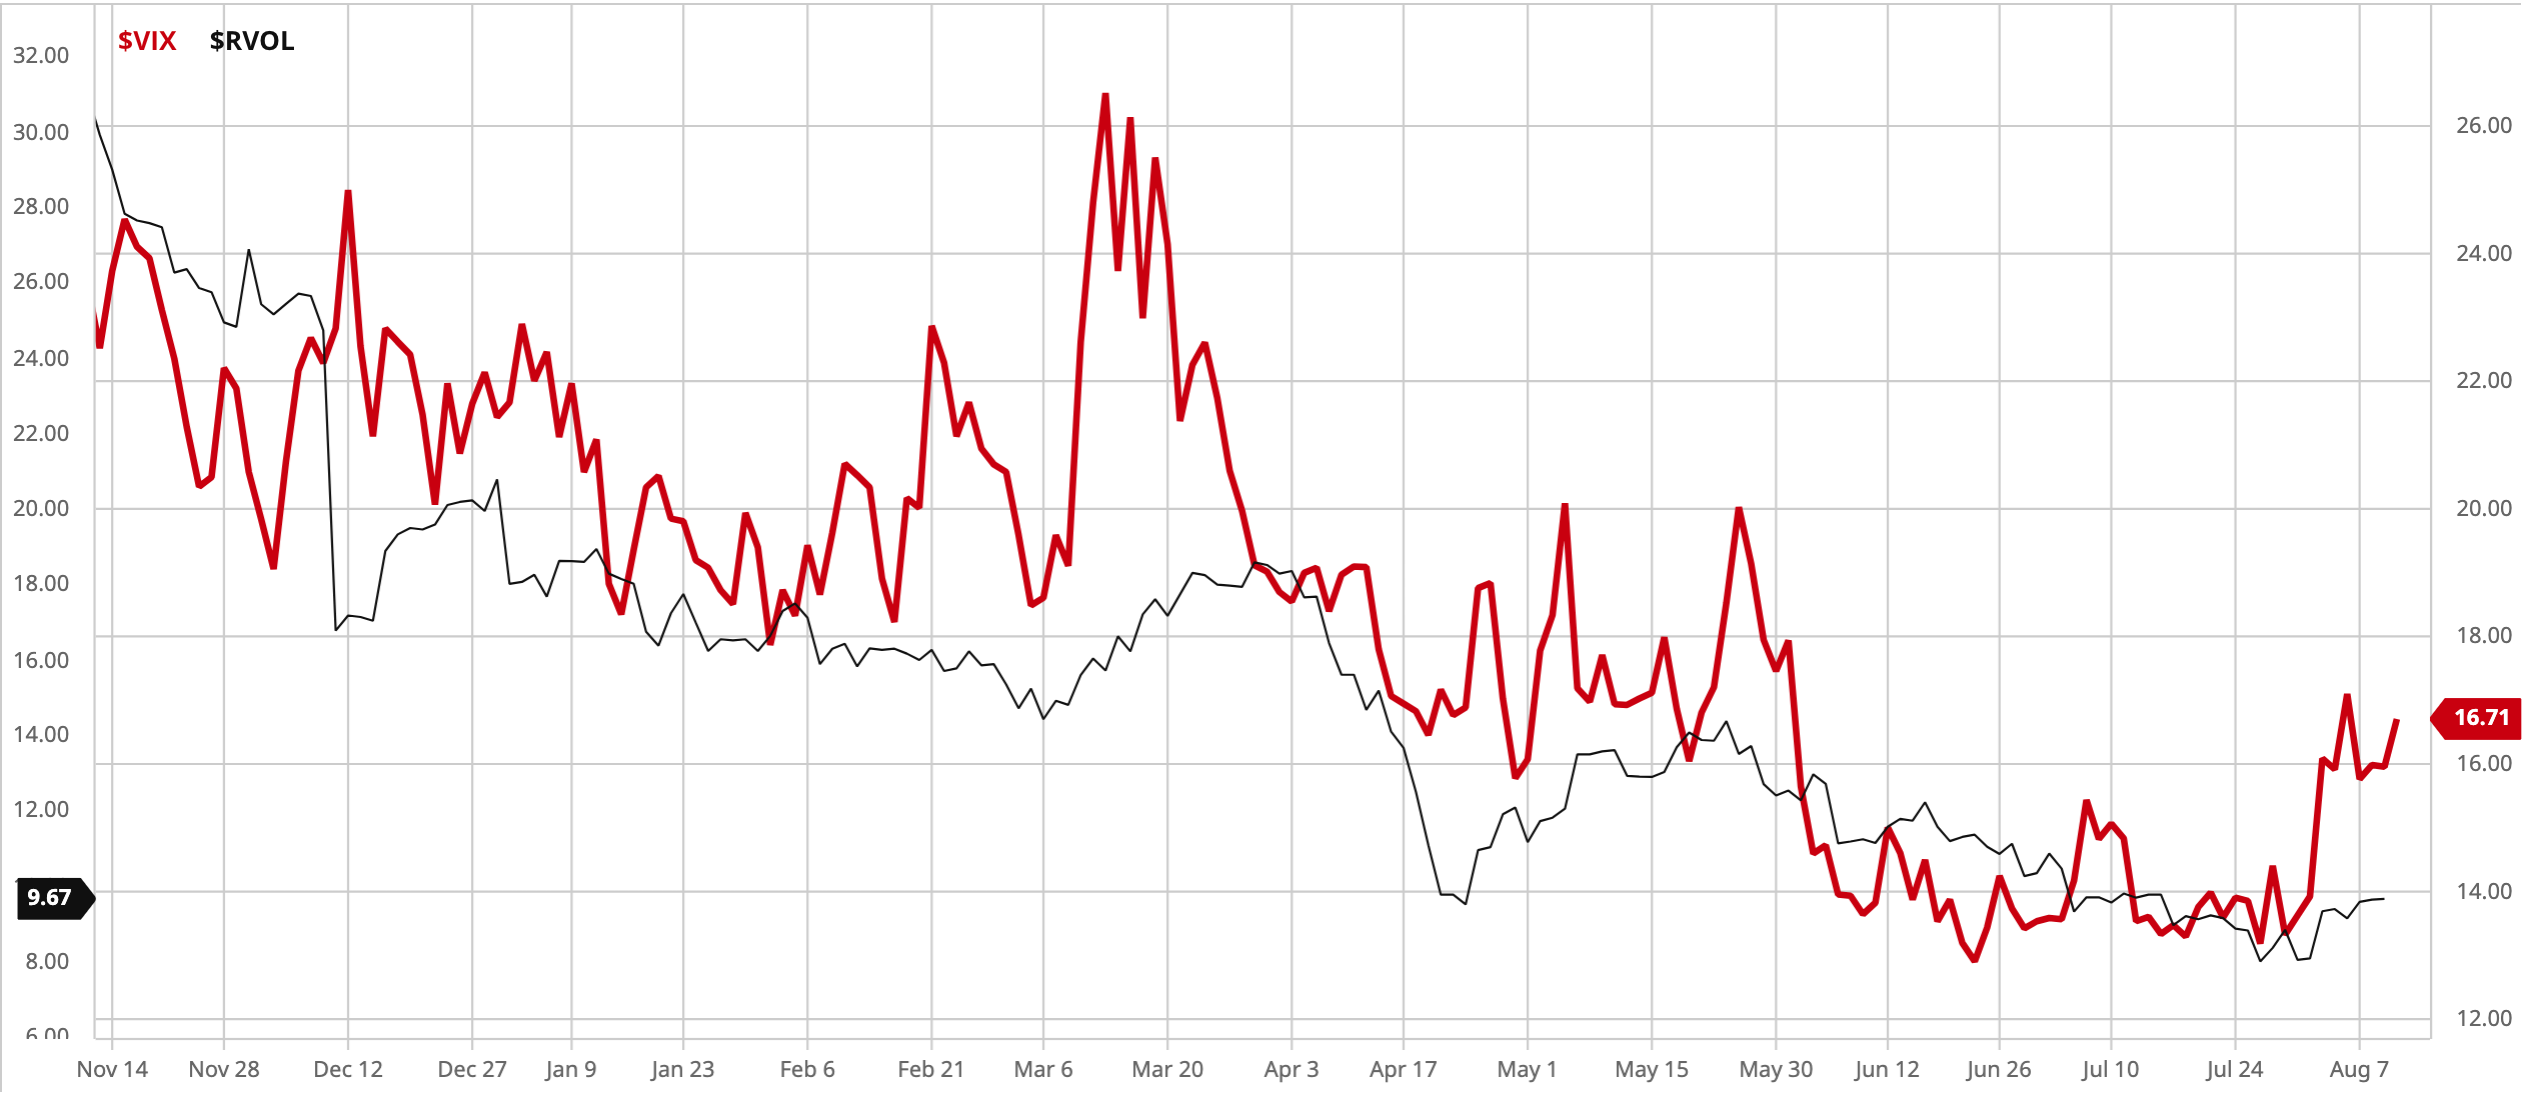
Implied Volatility is Often Overstated Relative to Realized Volatility
Volatility measures the frequency and magnitude of price movements, both up and down, that a stock, bond, commodity, or currency market experiences over time. The more dramatic the price swings, the fast and wider prices… Read More
-
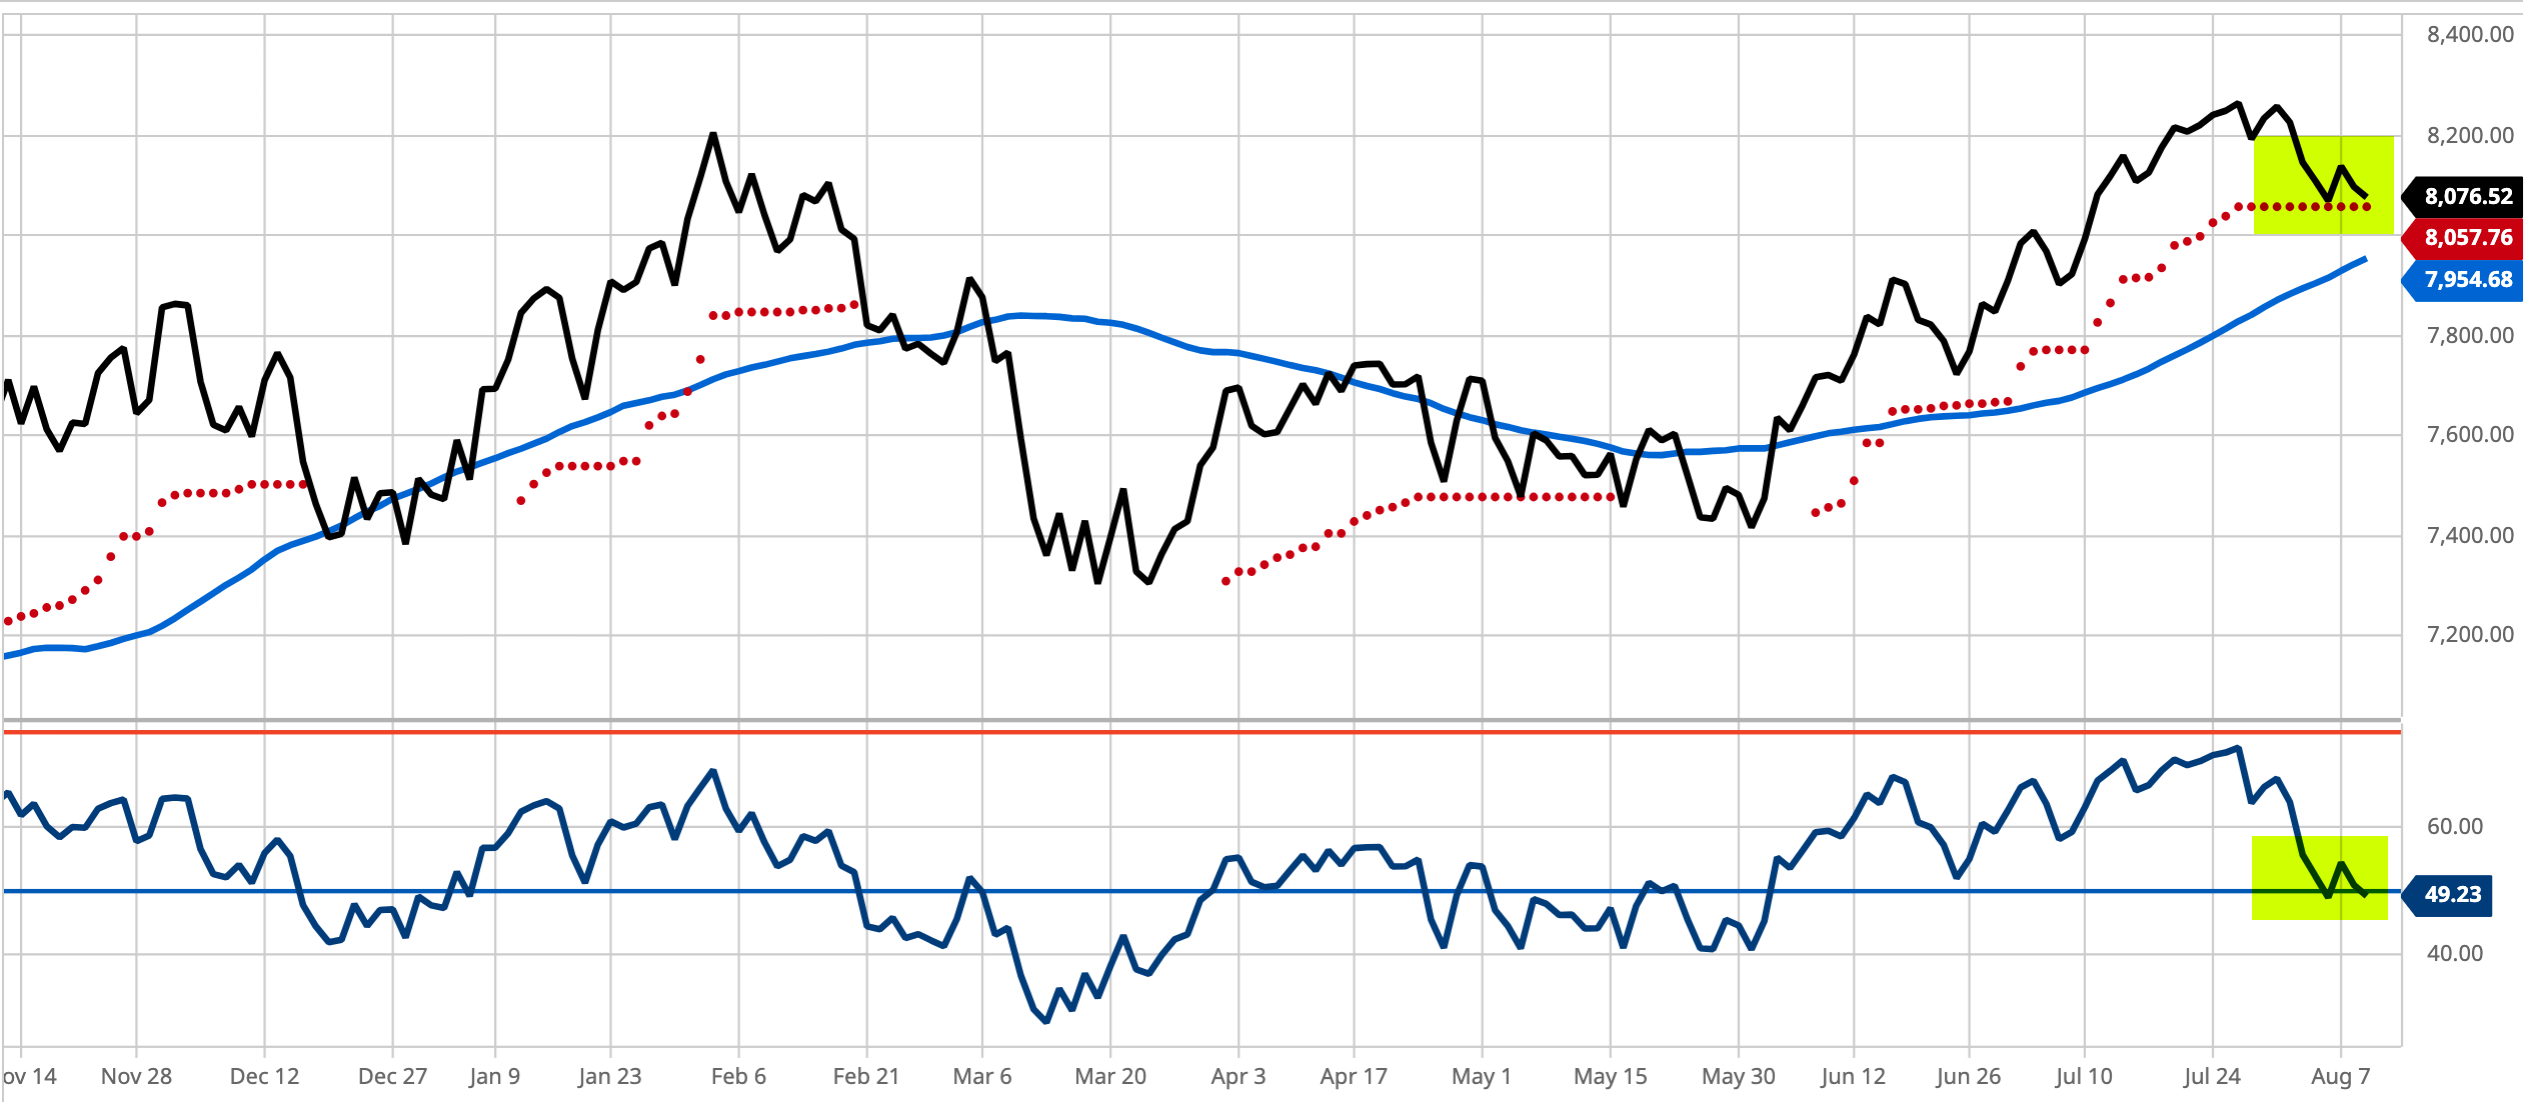
Technically Speaking the Stock Market is at an Inflection Point
For the past 25 years, my expertise has been in applying mathematical models and quantitative methods to financial markets to determine the direction, momentum, and volatility of price trends in order to identify emerging trends… Read More
-
US Dollar Trends Back Down After an Oversold Countertrend
I pointed out in Downtrend but Statistically Oversold Short-Term as Gold Turns Up the US Dollar had reached a statistically oversold level, setting up a high probability for a countrend. Below is the chart I shared… Read More
-

Panic/Euphoria Model is Nearing Euphoria as Investors Follow the Trend
We actively monitor dozens of investor sentiment gauges. One of the sentiment indicators we monitor is the Citigroup Panic/Euphoria Model, and when it reaches an extreme, I share it here. According to Citi, the panic/euphoria model… Read More
-
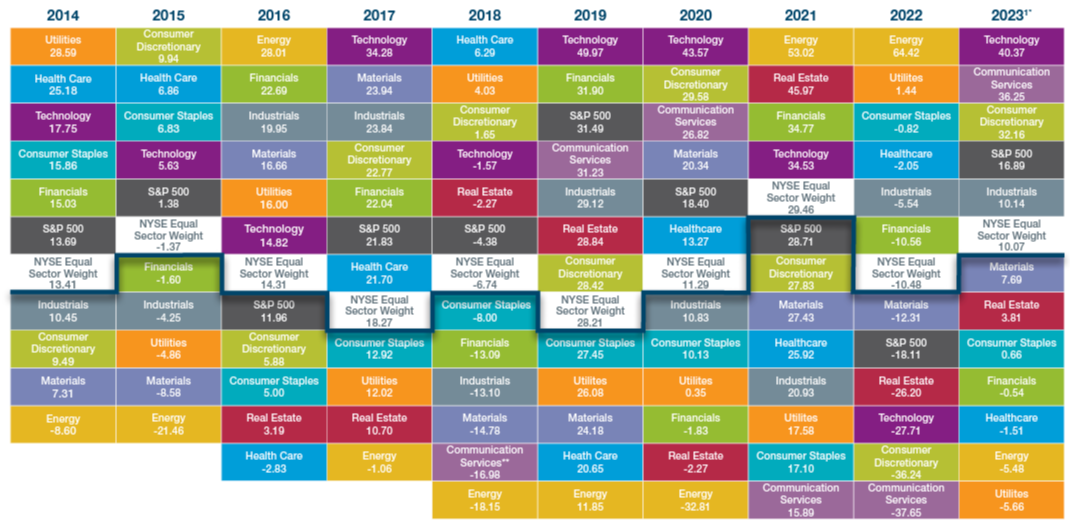
The Divergence Between the Best and Worst Performing Sectors is 45% a Year the Last Decade, and a 20 Year High
Divergence between price trends offers active investment strategies the opportunity to capture the trends with momentum and avoid downtrends. It isn’t as easy as it sounds, but the dispersion between sector trends performance can be… Read More
-

FOMC Meeting Review: Likely the Last Interest Rate Hike
Monetary policy in the United States comprises the Federal Reserve’s actions and communications to promote maximum employment, stable prices, and moderate long-term interest rates–the economic goals the Congress has instructed the Federal Reserve to pursue.… Read More
-

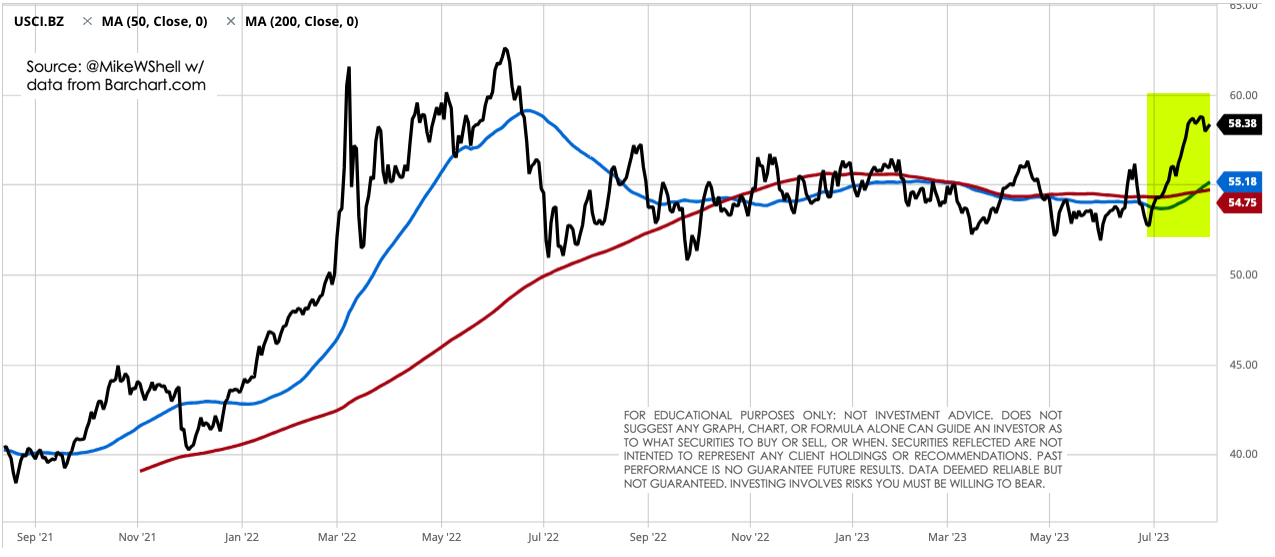
Here’s what a Linear Regression Channel of the S&P GSCI® Goldman Sachs Commodity Index is Telling
S&P GSCI® Goldman Sachs Commodity Index is a composite index of commodity sector returns representing an unleveraged, long-only investment in commodity futures broadly diversified across the spectrum of commodities. According to Goldman Sachs, the returns… Read More
-
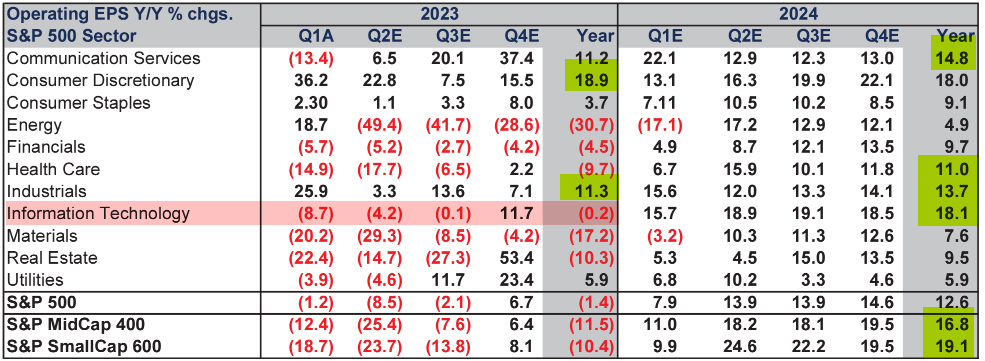
Sector Earnings Growth and Valuation into 2024
Back in July of last year the US stock market using the S&P 500 as a proxy was down about -23% and needed a 30% gain to get back to the prior high and I… Read More
-
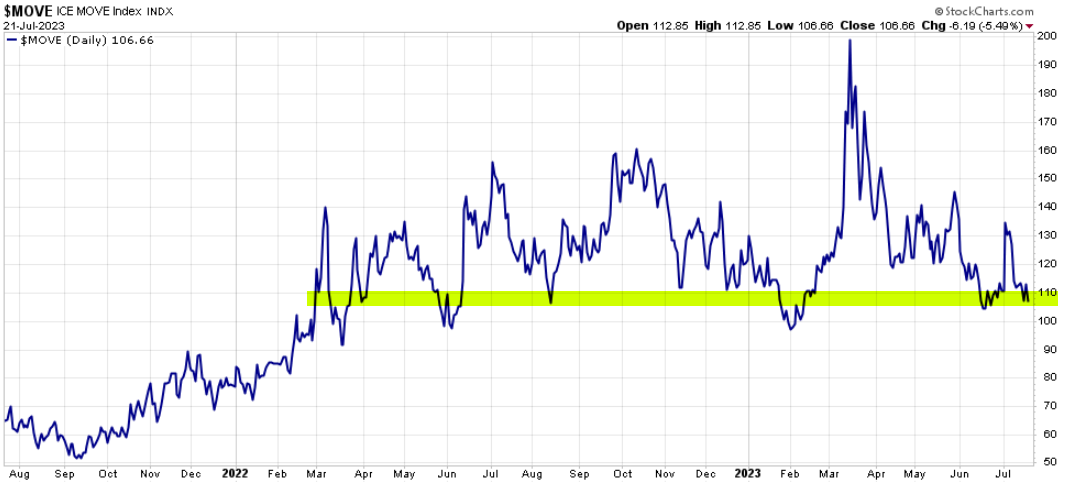
Bond Market Volatility Contraction and What it Means
The MOVE index (Merrill Lynch Options Volatility Estimate) is a market-implied measure of bond volatility similar to the CBOE Volatility Index ($VIX) for stocks. Some consider it fear in the bond market, as in uncertainty… Read More